adoctor-check Exception Detection Module
1 Description
The adoctor-check exception detection module is a tool that calculates and analyzes various running data collected from the nodes in the cluster to check whether there are abnormal data items.
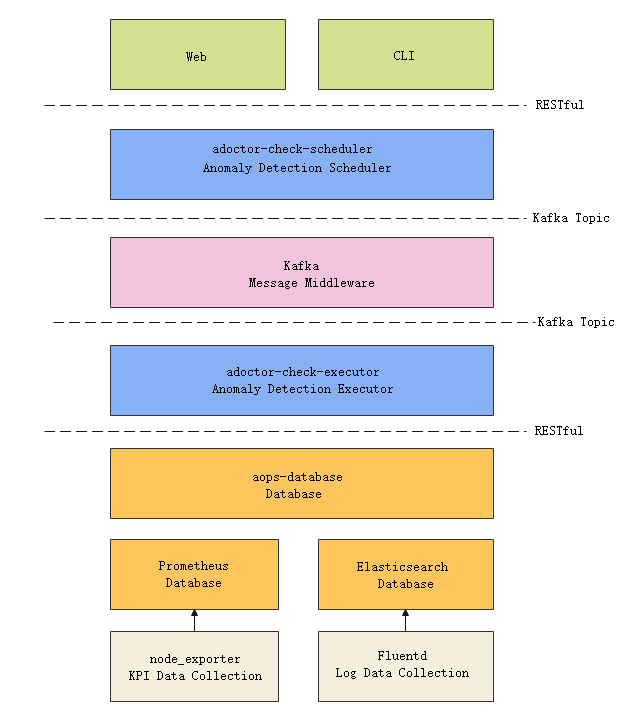
2 Architecture
The exception detection tool depends on the A-Ops framework and consists of the scheduler and executor modules.
3 Software Download
- Repo source ISO official release: https://repo.openeuler.org/
- Source code download: https://gitee.com/openeuler/A-Ops
- RPM package download: https://repo.openeuler.org/openEuler-22.03-LTS/EPOL/main/
4 Operating Environment
- Hardware configuration:
Configuration Item Recommended Specification CPU 8 cores Memory 32 GB (minimum: 4 GB) Network bandwidth 300 Mbps I/O 375 MB/s - Software configuration:
Software Version and Specifications Python Version 3.8 or later MySQL 8.0.26 Kafka 2.6.0 ZooKeeper 3.6.2 Elasticsearch 7.14.0 Prometheus 2.20.0 node_exporter 1.0.1 aops-database 1.0.1 aops-manager 1.0.1 Fluentd 1.13.3 fluentd-plugin-elasticsearch 5.0.5
5 Installation
5.1 Installing the A-Ops Framework
The exception detection module depend on the A-Ops framework. For details about the framework installation, see the A-Ops Framework Manual.
5.2 Installing the Dependent Components
The exception detection module depends on the messaging middleware and data collection module. Ensure that the ZooKeeper, Kafka, Prometheus, node_exporter, Elasticsearch and Fluentd components have been deployed in the environment. Elasticsearch is deployed during the installation of the A-Ops framework. You need to modify related configurations to receive the push of data collected by Fluentd on multiple hosts. You can run yum install prometheus2 to download Prometheus and yum install rubygem-fluentd to download Fluentd.
5.2.1 Installing Using the A-Ops Deployment Service
You can also install adoctor-check-scheduler and adoctor-check-executor in this step.
5.2.1.1 Editing the Task List
Modify the deployment task list and enable the steps for the ZooKeeper, Kafka, Prometheus, node_exporter, and Fluentd components:
---
step_list:
 zookeeper:
  enable: true
  continue: false
 kafka:
  enable: true
  continue: false
 prometheus:
  enable: true
  continue: false
 node_exporter:
   enable: true
   continue: false
 fluentd:
   enable: true
   continue: false
 ...
5.2.1.2 Editing the Host List
For details about the host configurations, see section 2.2.2 in the Deployment Management Manual.
5.2.1.3 Editing the Variable List
For details about the variable configurations, see section 2.2.2 in the Deployment Management Manual.
5.2.1.4 Executing the Deployment Task
For details about deployment task execution, see section 3 in the Deployment Management Manual.
5.2.2 Manual Installation
You can configure the openEuler Repo source to install the preceding dependent components. For details about the parameter configuration and cluster deployment , see the official documents of the softwares.
5.3 Installing adoctor-check
5.3.1 Manual Installation
Installing using the repo source mounted by Yum.
Configure the Yum sources openEuler22.03 and openEuler22.03:Epol in the /etc/yum.repos.d/openEuler.repo file.
[everything] # openEuler 22.03 officially released repository
name=openEuler22.03
baseurl=https://repo.openeuler.org/openEuler-22.03-LTS/everything/$basearch/
enabled=1
gpgcheck=1
gpgkey=https://repo.openeuler.org/openEuler-22.03-LTS/everything/$basearch/RPM-GPG-KEY-openEuler

[Epol] # openEuler 22.03:Epol officially released repository
name=Epol
baseurl=https://repo.openeuler.org/openEuler-22.03-LTS/EPOL/main/$basearch/
enabled=1
gpgcheck=1
gpgkey=https://repo.openeuler.org/openEuler-22.03-LTS/OS/$basearch/RPM-GPG-KEY-openEuler
Run the following commands to download adoctor-check and its dependencies.
yum install adoctor-check-scheduler
yum install adoctor-check-executor
Installing using the RPM packages. Download adoctor-check-scheduler, adoctor-check-executor, and aops-utils, and then run the following command to install the modules. (
x.x-xindicates the version. Replace it with the actual version number.)rpm -ivh adoctor-check-scheduler-x.x-x.oe1.noarch.rpm rpm -ivh adoctor-check-executor-x.x-x.oe1.noarch.rpm
5.3.2 Installing Using the A-Ops Deployment Service
You can install this module with the dependent components in section 5.2.1.
5.3.2.1 Editing the Task List
Modify the deployment task list and enable the steps for adoctor-check-scheduler and adoctor-check-executor:
---
step_list:
 ...
 adoctor_check_executor:
   enable: true
   continue: false
 adoctor_check_scheduler:
   enable: true
   continue: false
 ...
5.3.2.2 Editing the Host List
For details about the host configuration, see section 2.2.3.8 in the Deployment Management Manual.
5.3.2.3 Editing the Variable List
For details about the variable configuration, see section 2.2.3.8 in the Deployment Management Manual.
5.3.2.4 Executing the Deployment Task
See section 3 in the Deployment Management Manual to execute the deployment task.
6 Defining the Exception Detection Rules
Exception detection rules are defined based on the data that can be collected by the system.
6.1 Exception Detection Rule File Format
Exception detection rules must be imported in JSON format. Different users can import different detection rules. The detection rule list consists of check items. The following is an example of a check item:
"check_items": [
    {
        "check_item": "check_item2",
        "data_list": [
            {
                "name": "data1",
                "type": "kpi",
                "label": {
                    "cpu": "1",
                    "mode": "irq"
                 }
            }
        ],
        "condition": "$0>1",
        "plugin": "",
        "description": "data 1"
    },
    {
        "check_item": "check_item2",
        ...
    }
]
An exception detection rule contains the following fields:
| Field | Description | Type | Remarks |
|---|---|---|---|
| check_item | Name of the exception detection rule. | string | The name of the exception detection rule imported by a user must be unique. |
| data_list | List of data required for the exception detection. | list | |
| condition | Detection rule description. | string | A string to describe the exception. It is a condition for determining that the data in data_list is abnormal. |
| plugin | Name of the exception detection rule plugin. | string | If you use a custom exception detection rule plugin, set this parameter to the plugin name. If this parameter is left empty, the built-in expression plugin is used to parse the detection rule by default. |
| description | Description of the exception detection check item. | string |
6.2 Description of the Exception Detection Data Items
You need to describe the data required for calculation for each exception detection check item. The data is listed in data_list. The description of key fields in data_list is as follows:
| Field | Description | Type | Remarks |
|---|---|---|---|
| name | Name of the data item. | string | The data item name is unique within the data_list. |
| type | Type of the data. | string | The value can be kpi (indicator data) or log (log data). |
| label | Data label. | dict | Key-value pairs of data items recorded in the dictionary. You need to describe all labels of the data item. For details about the values of KPI data, see the metrics list of node_exporter. The label field is optional for log data. |
KPI data
Currently, KPI data is collected by node_exporter and stored in Prometheus. The data indicators that can be collected vary according to the node_exporter version. The supported data items are subject to the deployed node_exporter version.
- Data categories
The following categories are included:
Data Item Data Category node_cpu* System CPU metrics node_disk* Disk I/O metrics node_filesystem* File system metrics node_memory*, node_zoneinfo* System memory usage metrics node_netstat*, node_network*, node_sockstat* Network metrics node_load* System load metrics node_systemd* Service metrics node_time* Time-related metrics process* Prometheus process metrics go_* Go environment metrics - Data labels
The KPI data usually carries labels that represent its own characteristics. The labels are described in the form of a dictionary in the label field. A group of labels uniquely identifies a metric data record. The dimensions of the label may include the status, the feature, the environment definition, or the like of the monitoring data. An example is as follows:
node_cpu_seconds_total{cpu="0",mode="idle"}
node_cpu_seconds_total{cpu="0",mode="iowait"}
node_cpu_seconds_total{cpu="0",mode="irq"}
node_cpu_seconds_total{cpu="0",mode="nice"}
node_cpu_seconds_total{cpu="0",mode="softirq"}
node_cpu_seconds_total{cpu="0",mode="steal"}
node_cpu_seconds_total{cpu="0",mode="system"}
node_cpu_seconds_total{cpu="0",mode="user"}
...
node_cpu_seconds_total{cpu="95",mode="softirq"}
node_cpu_seconds_total{cpu="95",mode="steal"
node_cpu_seconds_total{cpu="95",mode="system"}
node_cpu_seconds_total{cpu="95",mode="user"}
Each of the data items above has the cpu and mode labels. The cpu label indicates the CPU core to which the data belongs. There are 96 CPU cores in total. The mode indicates the status of the CPU core. There are 8 status, such as idle (idle), user space process usage (user), and system space process usage (system).
For details about the data items supported by node_exporter, see the node_exporter official document.
Log data
Log data is collected by Fluentd and stored in Elasticsearch. Currently, the history logs and demesg logs of the system can be collected.
6.3 Conditions of the Exception Detection Rules
6.3.1 Exception Detection Expressions
By default, the exception detection rules use expressions to create the description of the collected data. The standard expressions look like follows:
<expression><operator><constant>
<expression><operator><expression>
expression is an expression that contains data variables. The data variables are described in data_list and are expressed following the order in data_list using $i macros.
For example, if data_list is as follows:
"data_list":
[{
 "name": "node_cpu_frequency_min_hertz",
 "type": "kpi",

},
{
 "name": "node_cpu_guest_seconds_total",
 "type": "kpi",
 "label": {
  "cpu": "1",

 }
},
{
 "name": "node_cpu_seconds_total",
 "type": "kpi"
}]
In this case, the condition should be similar to the following:
$0 + $1 * $2 >100
The meaning of the expression is as follows:
node_cpu_frequency_min_hertz + node_cpu_guest_seconds_total * node_cpu_seconds_total > 100
6.3.2 Operators
Currently, the following operators are supported:
| Priority | Operator | Definition | Usage |
|---|---|---|---|
| 1 | () | Parenthesis | (expression), function(parameter) |
| 2 | - | Minus sign operator | -expression |
| + | Plus sign operator | +expression | |
| + | ! | Logical NOT | !expression |
| ~ | Bitwise NOT | ~expression | |
| 3 | / | Division | expression1 / expression2 |
| * | Multiplication | expression1 * expression2 | |
| % | Remainder (modulo) | expression1 % expression2 | |
| 4 | + | Addition | expression1 + expression2 |
| - | Subtraction | expression1 - expression2 | |
| 5 | << | Left shift | expression1 << expression2 |
| >> | Right shift | expression1 >> expression2 | |
| 6 | > | Greater than | expression1 > expression2 |
| >= | Greater than or equal to | expression1 >= expression2 | |
| < | Less than | expression1 < expression2 | |
| <= | Less than or equal to | expression1 <= expression2 | |
| 7 | == | Equal to | expression1 == expression2 |
| != | Not equal to | expression1 != expression2 | |
| in | Included by | {key: value} in {ke1:value1, key2:value2, ...}. key and value can be expressions. | |
| notin | Not included by | {key: value} notin {ke1:value1, key2:value2, ...}. key and value can be expressions. | |
| 8 | & | Bitwise AND | expression1 & expression2 |
| 9 | ^ | Bitwise XOR | expression1 ^ expression2 |
| 10 | | | Bitwise OR | expression1 | expression2 |
| 11 | && | Logical AND | expression1 && expression2 |
| 12 | || | Logical OR | expression1 || expression2 |
| 13 | ?: | Condition operator | judge_expression ? expression_true : expression_false |
6.3.3 Functions
You can use functions to calculate the data in the expressions. The expression format is as follows:
# Compare the function calculation result of the specified data_name with constant:
<data_name>.function(<parameter>)<operator><constant>
# Compare the function calculation result of $0 with constant:
function(<parameter>)<operator><constant>
Function parameters
You can use time and quantity as filters in the functions.
Function Invocation Description max(30s) Maximum value of the data in the last 30 seconds. max(#5) Maximum value of the latest 5 data records. The unit of the time offset can be s (second), m (minute), or h (hour).
Function list
Function Name Description Parameter Data Type Remarks count(sec|#num, pattern, operator) Counts the data records that meet the conditions within a specified range of data. sec|#num: Offset in time or quantity; <pattern>: Value to be compared; <operator>: Logical relationship float, int,str count(10m,1,">"): Quantity of data records greater than 1 in the last 10 minutes. count(#15,"error","=="): Quantity of data records that are equal to "error" in the latest 15 data records. max(sec|#num) Calculates the maximum value of a specified range of data. sec|#num: Offset in time or quantity float, int max(#5): The maximum value of the latest 5 data records. max(5s): The maximum value of the data records in the last 5 seconds. min(sec|#num) Calculates the minimum value of a specified range of data. sec|#num: Offset in time or quantity float, int min(#5): The minimum value of the latest 5 data records. min(5s): The minimum value of data records in the last 5 seconds. sum(sec|#num) Calculates the sum of a specified range of data. sec|#num: Offset in time or quantity float, int sum(#5): The sum of the latest 5 data records. sum(5s): The sum of data records in the last 5 seconds. avg(sec|#num) Calculates the average value of a specified range of data. sec|#num: Offset in time or quantity float, int avg(#5): The average value of the latest 5 data records. avg(5s): The average value of data records in the last 5 seconds. keyword(pattern) Determines whether the current data contains the specified keyword string. pattern: Keyword string str keyword("error"): If the data contains the keyword "error", true is returned. Otherwise, false is returned. diff(sec|#num) Determines whether the current value is the same as a historical value. sec|#num: Offset in time or quantity float,int, str, true: The two values are the same. false: The two values are different. abschange(sec|#num) Calculates the absolute value of the difference between the current value and a history value. sec|#num: Offset in time or quantity float,int pre:1 cur:5 return: 4 pre:3 cur:1 return:2 pre:0 cur:-2.5 return 2.5 change(sec|#num) Calculates the difference between the current value and a historical value. sec|#num: Offset in time or quantity float,int pre:1 cur:5 return: 4 pre:3 cur:1 return:-2 pre:0 cur:-2.5 return -2.5
6.4 Custom Exception Detection Plugin
Customizing the exception detection plugin interface.
The custom exception detection plugin needs to inherit the CheckRulePlugin class in adoctor_check_executor.check_rule_plugins.check_rule_plugin.
Interface Function Input Value Return Value judge_condition Checks for anomalies. index: Coordinate in the time series data segment; data_vector: Time series data segment; main_data_name: Main data true: Anomalies found. false: No exception found. Sets the Plugin Manager. plugin_manager: Plugin manager Configuring the plugin file.
Add your custom exception detection rule plugin in
/etc/aops/check_rule_plugin.yml.--- plugin_list: - plugin_name: expression_rule_plugin file_name: expression_rule module_name: ExpressionCheckRule - plugin_name: my_plugin #Plugin name file_name: my_plugin #Plugin file module_name: Myplugin #Plugin class name- Move
my_plugin.pyand the files to be referenced to the installation directory of adoctor_check_executoradoctor_check_executor/check_rule_plugins. - Restart the adoctor-check-executor to load the custom plugins.
- Move
7 Parameter Configuration
7.1 Configuring the adoctor-check-scheduler
By default, the adoctor-check-scheduler configuration file is stored as /etc/aops/check_scheduler.ini. Modify the file as required.
vim /etc/aops/check_scheduler.ini
; Kafka producer parameters.
[producer]
; List of Kafka hosts, which is in HOST:PORT format. The default port number is 9092, and the default IP address is localhost.
kafka_server_list = 192.168.1.1:9092
; Kafka API version. The default value is 0.11.5.
api_version = 0.11.5
; The number of ACK messages received by the Kafka leader before the leader confirms a request is complete. The default value is 1.
; 0: The producer does not wait for the ACK message from the server. The message is immediately added to the socket buffer and set as already sent. There is not guarantee that the server has received the message. The offset returned for each message is always -1.
; 1: The leader writes the record only to the local host. The broker does not wait for responses from all followers.
; all: The producer waits for all synchronized replications to write the record.
acks = 1
; If the value is greater than 0, the client resends the message when the message fails to be sent.
retries = 3
; The time to wait before the producer retries a failed request, in milliseconds.
retry_backoff_ms = 100

; Kafka consumer parameters.
[consumer]
; List of Kafka hosts, which is in HOST:PORT format. The default port number is 9092, and the default IP address is localhost.
kafka_server_list = 192.168.1.1:9092
; If the value is True, the consumer periodically commits the offset in the background.
enable_auto_commit = False
; Policy for resetting the offset when the OffsetOutOfRange error occurs.
; earliest: Move the offset to the earliest available message.
; latest: Move the offset to the latest message.
auto_offset_reset = earliest
; The time that the consumer spends waiting if there is no data in the buffer when the consumer performs the poll operation. If the value is 0, the current available records in the buffer are returned immediately. Otherwise, null is returned.
timeout_ms = 5
; Maximum number of records returned by a single poll of the consumer.
max_records = 3

; check scheduler configuration parameters.
[check_scheduler]
; check scheduler listening address.
ip = 127.0.0.1
; check scheduler listening port.
port = 11112
; Maximum number of task retry times when no data is available or an internal error occurs during exception detection.
max_retry_num = 3
; The cooldown period before the next retry if a retry fails.
cool_down_time = 120
; Maximum number of task IDs recorded in the cache of the dead tasks, that is, the tasks whose number of retry time exceeds the maximum. The cache is cleared when the maximum number is reached.
max_dead_retry_task = 10000
; Percentage of dead tasks to be cleared. By default, 50% of the cache is deleted when the number of recorded dead task IDs exceeds 10000.
dead_retry_task_discount = 0.5
; Time step of the backward detection task (following the reversed timeline) after the check scheduler is started.
backward_task_step = 60
; Interval for triggering the backward tasks.
backward_task_interval = 30
; Interval for triggering the forward tasks (following the timeline).
forward_task_interval = 30
; Maximum interval for triggering a new forward task.
forward_max_task_step = 86400

; uWSGI configuration parameters.
[uwsgi]
; Script for starting the uWSGI.
wsgi-file=manage.py
; Log of the check uwsgi service .
daemonize=/var/log/aops/uwsgi/check_scheduler.log
; Timeout interval of HTTP connections.
http-timeout=600
; Server response timeout interval.
harakiri=600
Note that if the listening IP address and port of the check_scheduler service are changed, the IP address and port of check_scheduler in /etc/aops/system.ini must be changed accordingly.
7.2 Configuring the adoctor-check-executor
7.2.1 Basic Parameter Configuration
The default configuration file of the adoctor-check-executor is stored as /etc/aops/check_executor.ini. Modify the file as needed:
vim /etc/aops/check_executor.ini
; check scheduler configuration parameters.
[consumer]
; List of Kafka hosts, which is in HOST:PORT format. The default port number is 9092, and the default IP address is localhost.
kafka_server_list=192.168.1.1:9092
; If the value is True, the consumer periodically commits the offset in the background.
enable_auto_commit=False
; Policy for resetting the offset when the OffsetOutOfRange error occurs.
; earliest: Move to the earliest available message.
; latest: Move to the latest message.
auto_offset_reset=earliest
; The time that the consumer spends waiting if there is no data in the buffer when the consumer performs the poll operation. If the value is 0, the current available records in the buffer are returned immediately. Otherwise, null is returned.
timeout_ms=5
; Maximum number of records returned by a single poll invocation of the consumer.
max_records=3

; Kafka producer parameters.
[producer]
; List of Kafka hosts, which is in HOST:PORT format. The default port number is 9092, and the default IP address is localhost.
kafka_server_list=192.168.1.1:9092
; Kafka API version. The default value is 0.11.5.
api_version=0.11.5
; The number of ACK messages received by the Kafka leader before the leader confirms a request is complete. The default value is 1.
; 0: The producer does not wait for the ACK message from the server. The message is immediately added to the socket buffer and set as already sent. There is not guarantee that the server has received the message. The offset returned for each message is always -1.
; 1: The leader writes the record only to the local host. The broker does not wait for responses from all followers.
; all: The producer waits for all synchronized replications to write the record.
acks=1
; If the value is greater than 0, the client resends the message when the message fails to be sent.
retries=3
; The time to wait before the producer retries a failed request, in milliseconds.
retry_backoff_ms=100

; check executor configuration parameters.
[executor]
; Relative path for loading the plugin. The relative path is referenced from the Python package of adoctor_check_executor.
plugin_path = adoctor_check_executor.check_rule_plugins
; Number of consumers for which exception detection is performed.
do_check_consumer_num = 2
; The sampling period for collecting data. It must be the same as the scraping interval in Prometheus configuration. Otherwise, the detection result will be inaccurate.
sample_period = 15
7.2.2 Custom Exception Detection Rule Plugin Configuration
The rule plugins for exception detection are configured in /etc/aops/check_rule_plugin.yml. By default, the built-in expression_rule_plugin is configured. You can add custom plugins by referring to the configuration in section 6.4.
8 Exception Detection Rule Management
8.1 Importing Exception Detection Rules
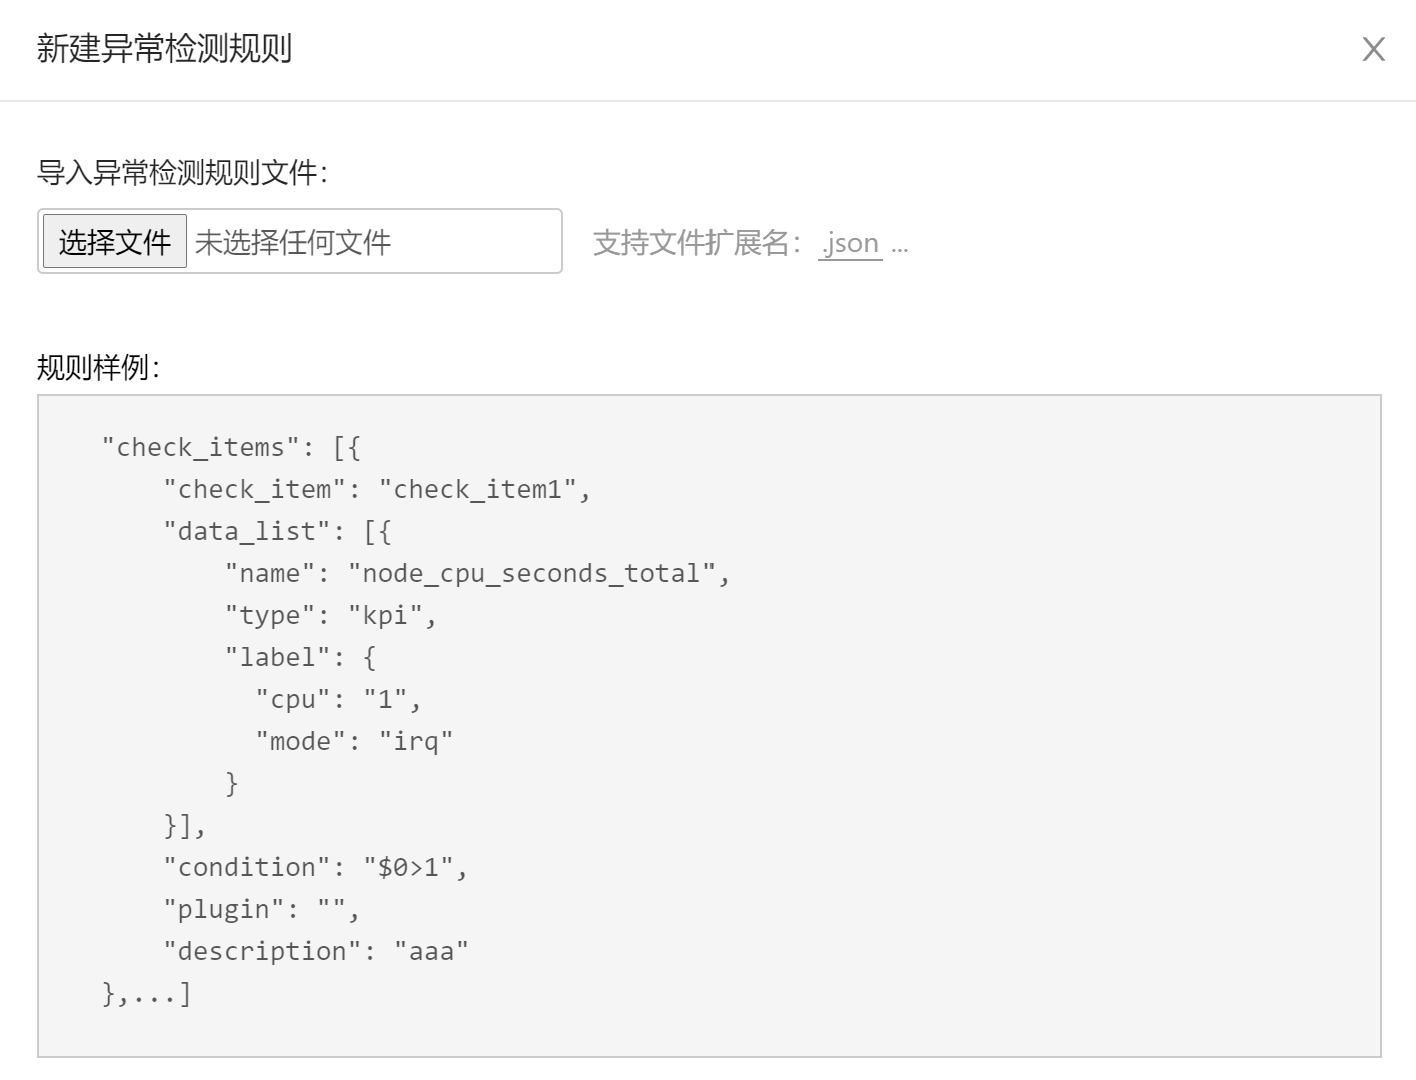
8.1.1 Using the Web Page
- Prepare the JSON file of exception detection rules.
- Open the Rule Management page and create exception detection rules.
8.1.2 Using the CLI
Log in to the server where adoctor-check-scheduler is deployed.
Prepare the JSON file of exception detection rules and copy the file to the server.
Run the following command:
adoctor checkrule [--action] add [--conf] [check.json] [--access_token] [token]Parameter description:
- action: The value add indicates the add operation.
- conf: Indicates the rule file to be imported.
- access_token: Access token.
For example, to import the
check_rule.jsonfile, run the following command:adoctor checkrule --action add --conf check_rule.json --access_token "1111"
8.2 Deleting Exception Detection Rules
8.2.1 Using the Web Page
- Open the Rule Management page.
- Delete the rule from the rule list.

8.2.2 Using the CLI
Log in to the server where adoctor-check-scheduler is deployed.
Run the following command:
adoctor checkrule [--action] delete [--check_items] [items] [--access_token] [token]Parameter description:
- action: The value delete indicates the delete operation.
- check_items: Indicates the check items to be deleted. Multiple check items are separated by commas (,). If this parameter is left empty, no check item is deleted.
- access_token: Access token.
For example, to delete the check item cpu_usage_overflow, run the following command:
adoctor checkrule --action delete --check_items cpu_usage_overflow --access_token "1111"
8.3 Obtaining Exception Detection Rules
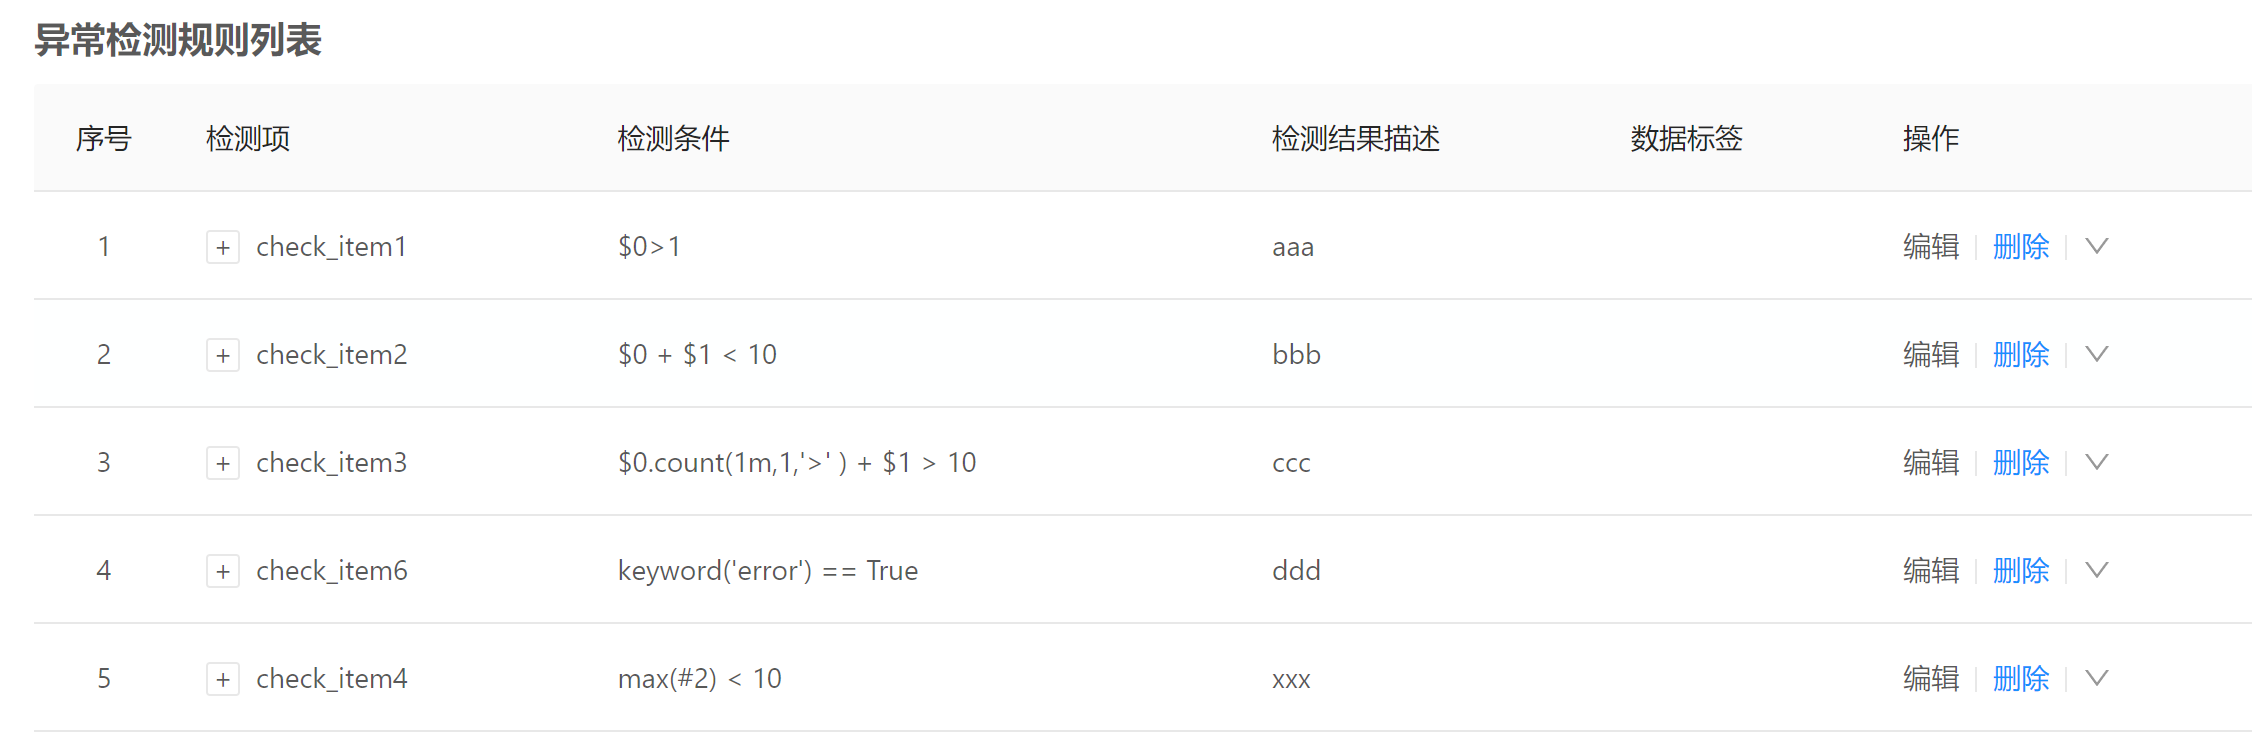
8.3.1 Using the Web Page
- Open the Exception Detection Rule List to view the exception detection rules.
8.3.2 Using the CLI
Log in to the server where adoctor-check-scheduler is deployed.
Run the following command:
adoctor checkrule [--action] get [--check_items] [items] [--export] [path] [--sort] [{check_item}] [--direction] [{asc, desc}] [--page] [page] [--per_page] [per_page] [--access_token] [token]Parameter description:
- action: The value get indicates the obtain operation.
- check_items: Indicates the check items to be obtained. Multiple check items are separated by commas (,). If this parameter is left empty, all check items are obtained.
- sort: Sorts exception detection results. The value can be start, end, or check_item. If the value is empty, the results are not sorted.
- direction: Specifies the order of abnormal results. The value can be asc (ascending order) or desc (descending order). The default value is asc.
- page: Current page number.
- per_page: Number of records on each page. The maximum value is 50.
- access_token: Access token.
For example, to export the check item cpu_usage_overflow, obtain only the first page, display 30 items on each page, and save the results to the
/tmpdirectory, run the following command:adoctor checkrule --action get --check_items cpu_usage_overflow --export /tmp --page 1 --per_page 30 --access_token "1111"
9 Using the Exception Detection Functions
9.1 Executing Exception Detection
When started, the adoctor-check-scheduler and adoctor-check-executor services begin to perform both real-time and historical exception detection. The historical exception detection is performed backwards in timeline based on the configured time step.
9.2 Obtaining Exception Detection Results
9.2.1 Using the Web Page
View the Exception Detection Records list.
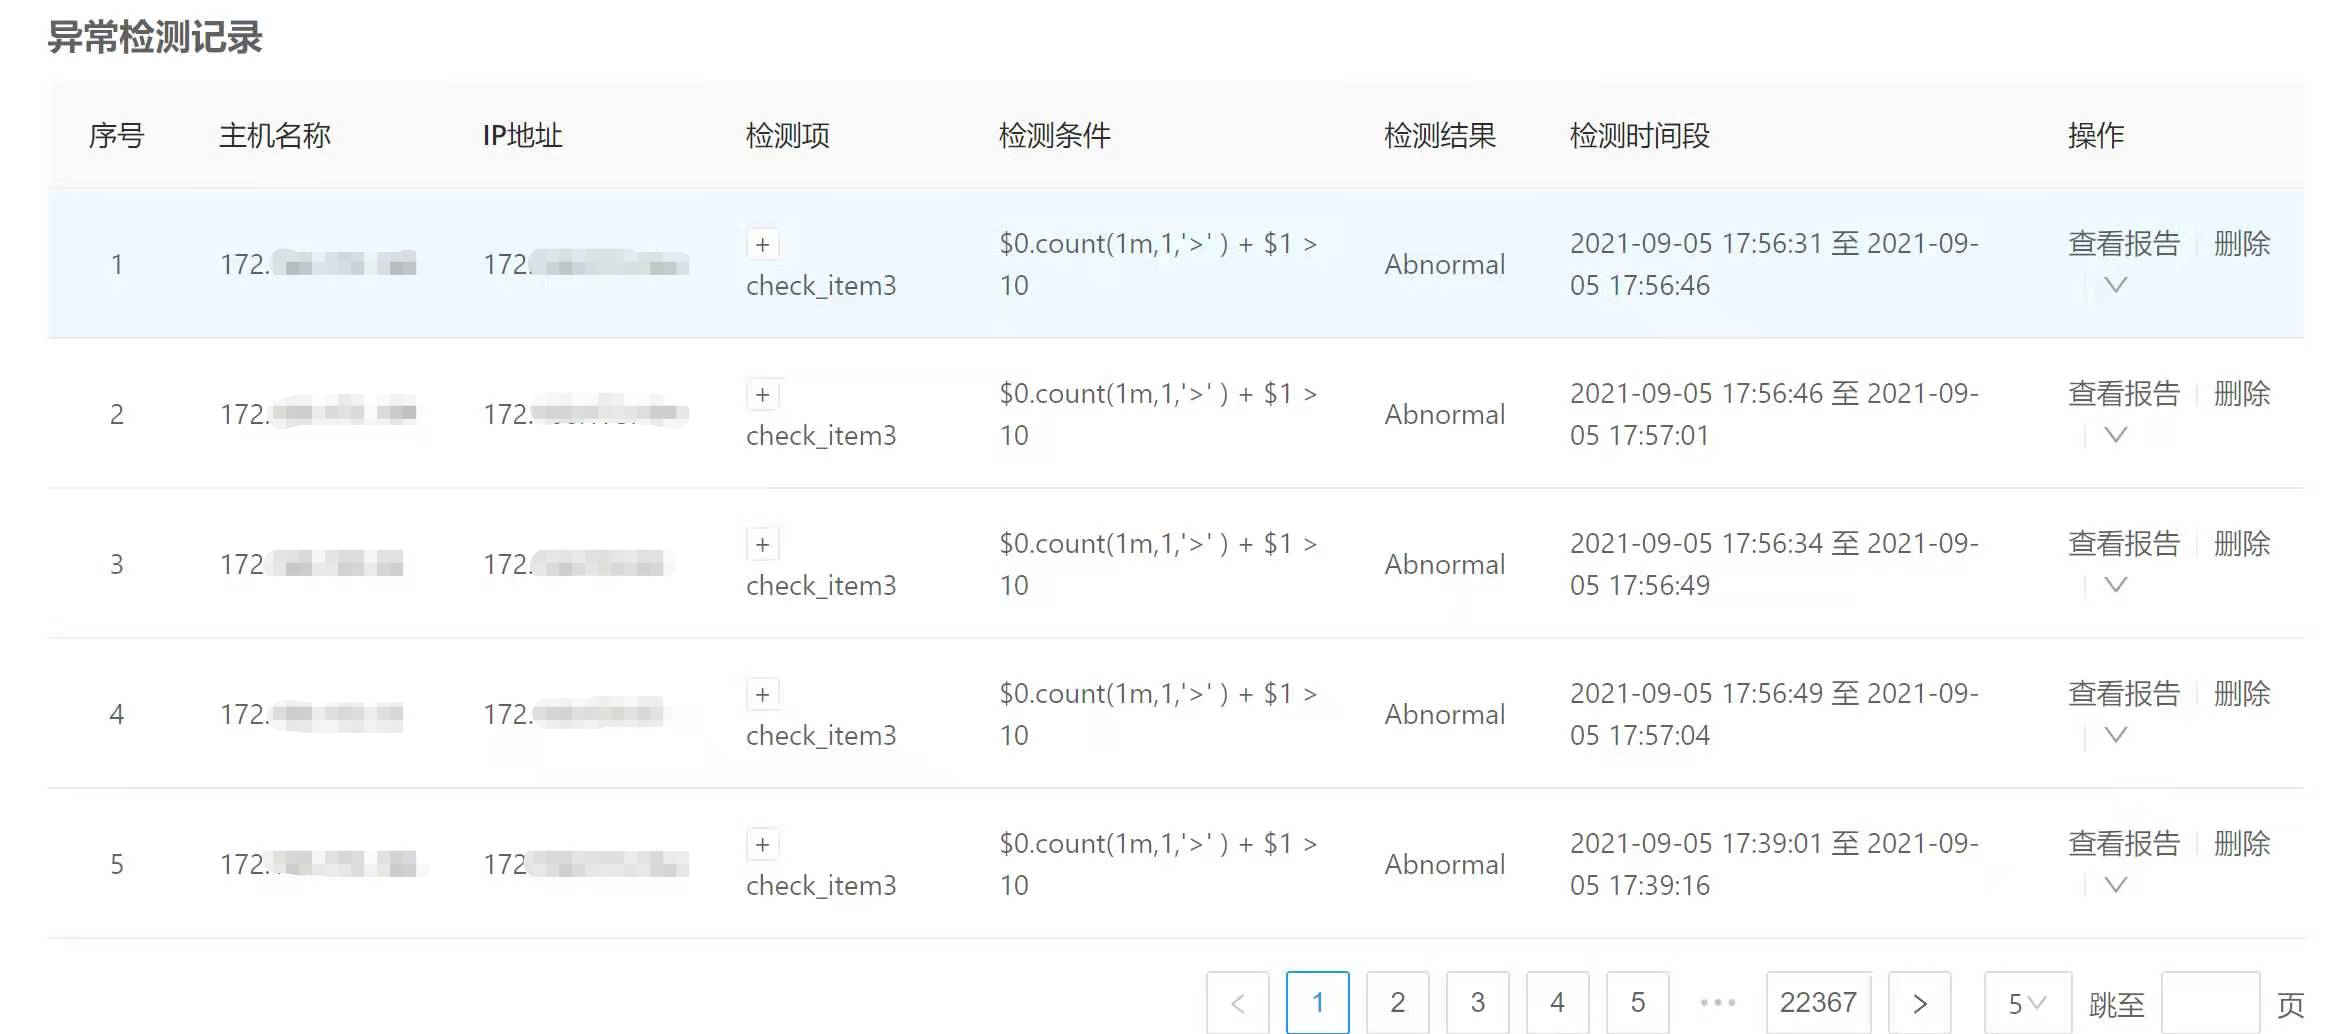
View the the Exception Detection Result Statistics.
9.2.2 Using the CLI
Log in to the server where adoctor-check-scheduler is deployed.
Ensure that adoctor-cli has been installed.
Run the following command:
adoctor check [--check_items] [items] [--host_list] [list] [--start] [time1] [--end] [time2] [--sort] [{check_item, start, end}] [--direction] [{asc, desc}] [--page] [page] [--per_page] [per_page] [--access_token] [token]Parameter description:
- check_items: Specifies the check items. Multiple check items are separated by commas (,). If this parameter is left empty, all check items are specified.
- host_list: Specifies the list of hosts. Multiple hosts are separated by commas (,). If this parameter is left empty, all hosts are specifies.
- start: Specifies the start time of exception detection. The format is similar to 20200101-11:11:11. If this parameter is not specified, the start time is one hour before the end time by default.
- end: Specifies the end time of exception detection. If this parameter is not specified, the current time is used by default.
- sort: Sorts exception detection results. The value can be start, end, or check_item. If the value is empty, the results are not sorted.
- direction: Specifies the order of abnormal results. The value can be asc (ascending order) or desc (descending order). The default value is asc.
- page: Current page number.
- per_page: Number of records on each page. The maximum value is 50.
- access_token: Access token.
For example, to obtain the exception detection results of check_item1 on host1 from 2021-9-8 11:24:10 to 2021-9-9 09:00:00 on the first page only, display 30 results on each page, and sort the results in ascending order by check_item, run the following command:
adoctor check --check_items check_item1 --host_list host1 --start 20210908-11:24:10 --end 20210909-09:00:00 --sort check_item --direction asc --page 1 --per_page 30 --access_token "1111"
10 Viewing and Dumping Logs
- adoctor-check-scheduler logs
- Path:
/var/log/aops/uwsgi/check_scheduler.log - Function: Records internal running logs of the code to facilitate fault locating.
- Permission: The path permission is 755. The log file permission is 644. Common users can view the logs.
- Debug log switch: log_level in the
/etc/aops/system.inifile.
- Path:
- adoctor-check-executor logs
- Path:
/var/log/aops/aops.log - Function: Records internal running logs of the code to facilitate fault locating.
- Permission: The path permission is 755. The log file permission is 600. Common users can view the logs.
- Toggling Debug log: log_level in the
/etc/aops/system.inifile.
- Path: