Fault Diagnosis Module
Description
The fault diagnosis module considers the combination of anomaly detection results, and analyzes and displays possible faults in a tree diagram.
This module consists of two sub-modules:
- The diagnosis scheduler module: Responds to the RESTful requests sent by upper-layer users, generates diagnosis messages, and sends the messages to the message queue for the diagnosis executor to perform diagnosis.
- The diagnosis executor module: Reads messages from the message queue, performs diagnosis, and saves the diagnosis results to the database.
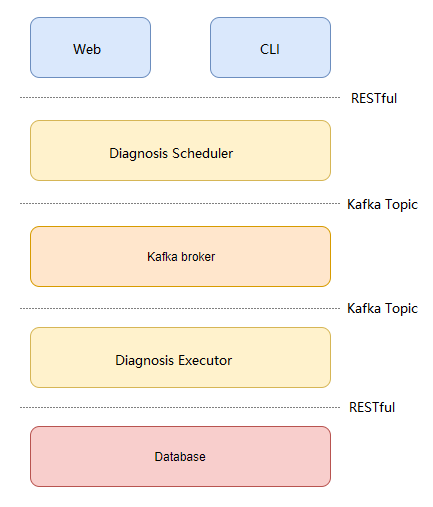
Architecture
The system is developed using Flask-RESTful. The following figure shows the architecture.
Installation
Installing the A-Ops Framework and Anomaly Detection Component
The fault diagnosis component depends on the A-Ops framework and anomaly detection service. For details about how to install the A-Ops framework and anomaly detection service, see the A-Ops Framework Manual and Anomaly Detection Service Manual.
Installing the fault diagnosis component
Manual Installation
Installing using the repo source mounted by Yum.
Configure the Yum sources openEuler22.03 and openEuler22.03:Epol in the /etc/yum.repos.d/openEuler.repo file.
[everything] # openEuler 22.03 officially released repository
name=openEuler22.03
baseurl=https://repo.openeuler.org/openEuler-22.03-LTS/everything/$basearch/
enabled=1
gpgcheck=1
gpgkey=https://repo.openeuler.org/openEuler-22.03-LTS/everything/$basearch/RPM-GPG-KEY-openEuler

[Epol] # openEuler 22.03:Epol officially released repository
name=Epol
baseurl=https://repo.openeuler.org/openEuler-22.03/EPOL/main/$basearch/
enabled=1
gpgcheck=1
gpgkey=https://repo.openeuler.org/openEuler-22.03/OS/$basearch/RPM-GPG-KEY-openEuler
Run the following commands to download and install adoctor-diag and its dependencies.
yum install adoctor-diag-scheduler
yum install adoctor-diag-executor
Installing using the RPM packages. Download adoctor-diag-scheduler, adoctor-diag-executor, and aops-utils, and then run the following commands to install the modules. (
x.x-xindicates the version. Replace it with the actual version number.)rpm -ivh adoctor-diag-scheduler-x.x-x.oe1.noarch.rpm rpm -ivh adoctor-diag-executor-x.x-x.oe1.noarch.rpm
Installing Using the A-Ops Deployment Service
Editing the Task List
Modify the deployment task list and enable the steps for adoctor-diag-scheduler and adoctor-diag-executor:
---
step_list:
 ...
 adoctor_diag_executor:
   enable: true
   continue: false
 adoctor_diag_scheduler:
   enable: true
   continue: false
 ...
Editing the Host List
For details about the host configuration, see section 2.2.3.9 in the Deployment Management Manual.
Editing the Variable List
For details about the variable configuration, see section 2.2.3.9 in the Deployment Management Manual.
Executing the Deployment Task
See section 3 in the Deployment Management Manual to execute the deployment task.
Parameters
- Set the parameters in the configuration files. The default configuration files of the module are
/etc/aops/diag_scheduler.iniand/etc/aops/diag_executor.ini. Modify the configuration files as needed.
vim /etc/aops/diag_scheduler.ini
[producer]
# IP address of the Kafka server. Use the actual IP address of the host.
kafka_server_list=10.0.0.0:9092
# Specify the Kafka API version.
api_version=0.11.5
# acks: The value 0 indicates that the producer ignores whether the message is successfully sent. The value 1 indicates that the producer waits for the leader to successfully write the logs. The value all indicates that the producer waits for all replications to write the logs.
acks=1
# Number of attempts to resend a message after the message fails to be sent.
retries=3
# Retry interval, in milliseconds.
retry_backoff_ms=100

[topic]
# Topic of the diagnosis.
name=DIAGNOSE_EXECUTE_REQ

[diag_scheduler]
# IP address used to start the Flask service.
ip=127.0.0.1
# Port number used to start the Flask service.
port=60116

[uwsgi]
# Script for starting the service.
wsgi-file=manage.py
# Operation log path.
daemonize=/var/log/aops/uwsgi/diag_scheduler.log
# Network connection timeout interval.
http-timeout=600
# Service running timeout interval.
harakiri=600
vim /etc/aops/diag_executor.ini
[consumer]
# IP address of the Kafka server. Use the actual IP address of the host.
kafka_server_list=10.0.0.0:9092
# Consumer group. The consumer of a message is unique within a consumer group.
group_id=DiagGroup
# Whether to automatically submit the offset.
enable_auto_commit=False
# How the offset is reset. The value earliest indicates that the offset is reset to the earliest available message. The value latest indicates that the offset is reset to the latest message.
auto_offset_reset=earliest
# The time in milliseconds that the consumer spends waiting before it polls messages from the buffer.
timeout_ms=5
# Number of messages polled at a time.
max_records=3

[topic]
# Diagnosis topic to be consumed.
name=DIAGNOSE_EXECUTE_REQ
Starting and Stopping the Service
e systemctl to start the deployed diagnosis scheduler and diagnosis executor.
systemctl start adoctor-diag-scheduler # Start the diagnosis scheduler service.

systemctl stop adoctor-diag-scheduler # Stop the diagnosis scheduler service.

systemctl restart adoctor-diag-scheduler # Restart the diagnosis scheduler service.
systemctl start adoctor-diag-executor # Start the diagnosis executor service.

systemctl stop adoctor-diag-executor # Stop the diagnosis executor service.

systemctl restart adoctor-diag-executor # Restart the diagnosis executor service.
Fault Diagnosis Operations
You can perform the following operations with the diagnosis module: fault tree operations, diagnosis operations, and diagnosis task operations. Most operations can be performed using the web interface or CLI commands. You can select the operation method based on the scenario.
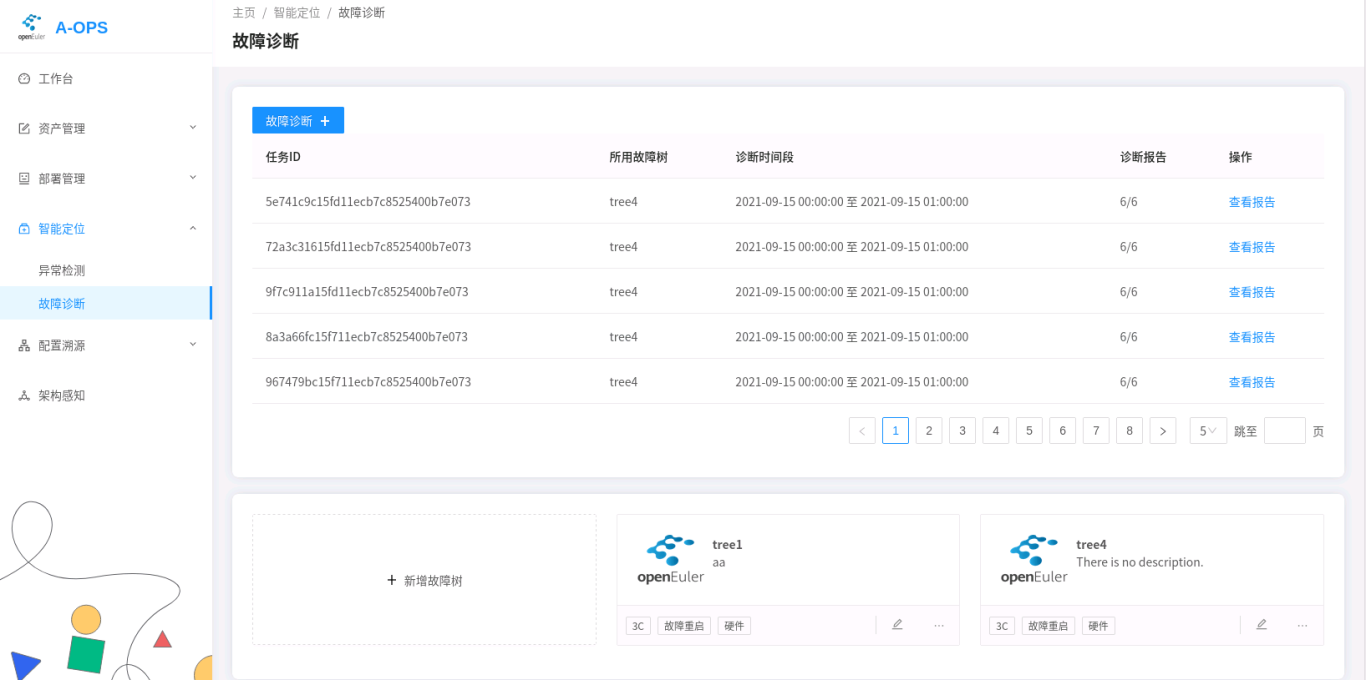
The following figure shows the fault diagnosis page.
Fault Tree Operations
Importing a Fault Tree.
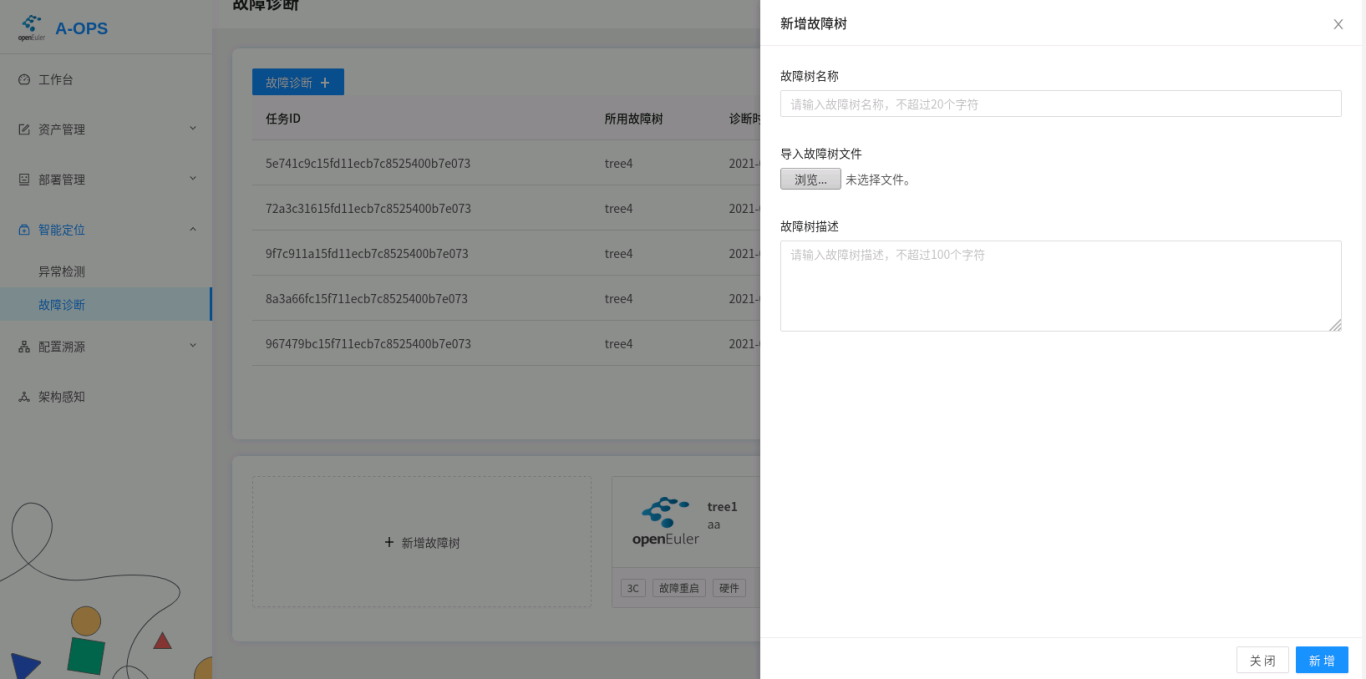
- Web:
Click Add Fault Tree. On the displayed page, specify the name, local file, and description of the diagnosis tree to add the diagnosis tree to the database:
CLI:
adoctor faultree --action add --tree_list tree1 --conf [conf.json] [--access_token] [token]Mandatory parameters--confSpecifies the fault tree file in JSON format. This parameter is mandatory when the action option is set to add.
--tree_listSpecifies the name of the diagnosis tree to be inserted. (Note that you can only add one diagnosis tree at a time.)
--access_tokenAccess Token.
Example- Import the fault tree tree1.
adoctor faultree --action add --tree_list tree1 --conf tree1.json --access_token token
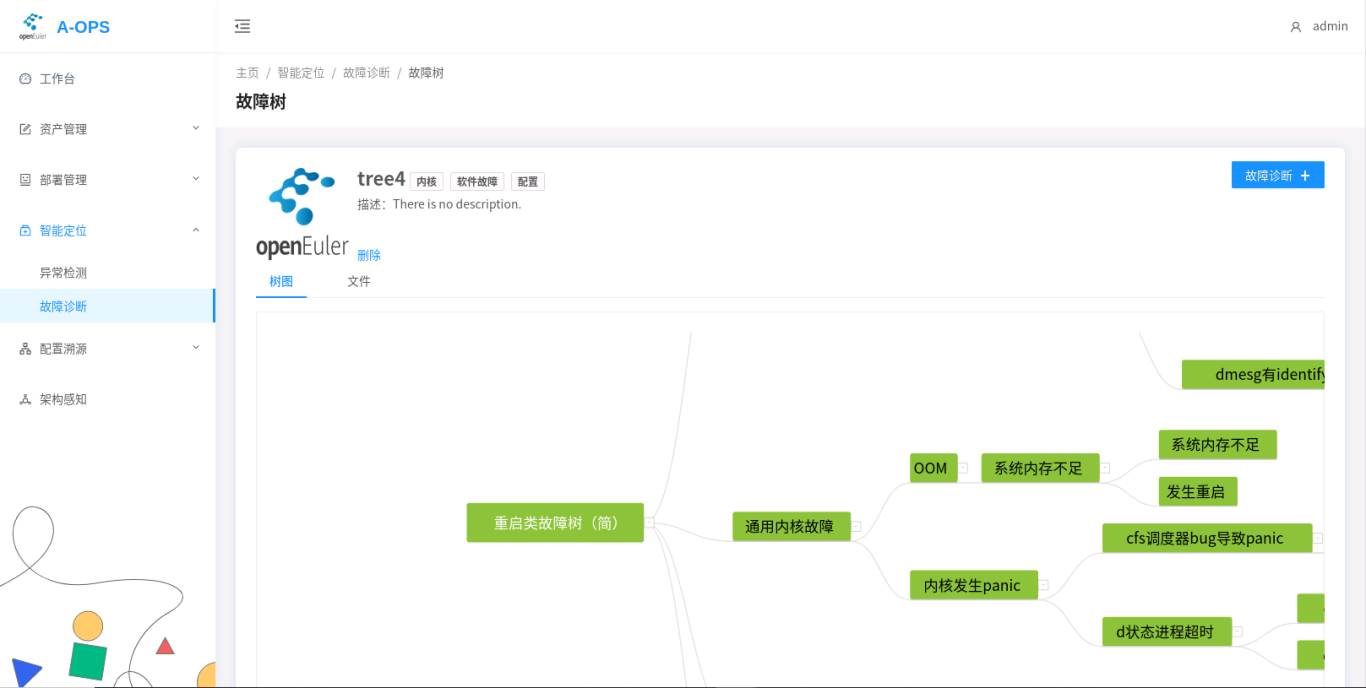
Viewing, Exporting, and Deleting Fault Trees.
- Web:
On the right of the Add Fault Tree area, click the operation button in the lower right corner of a fault tree to delete the tree. Currently, exporting a fault tree is not supported on the web interface.
Click a fault tree to view its details. You can also delete a fault tree on this page.
CLI:
adoctor faultree [--action] [action] [--tree_list] [list] [--export] [path] [--access_token] [token]Mandatory parameters--actiondelete indicates that the fault tree is deleted. get indicates that the fault tree is obtained.
--access_tokenAccess Token.
Optional parameters--tree_listSpecifies the fault tree to be deleted or obtained. Multiple fault trees are separated by commas (,). If the action is get and this parameter is left blank , all fault trees are obtained. If the action is delete and this parameter is left blank, no operation is performed.
--exportSpecifies the path to which the fault tree is exported. This parameter is used when action is set to get.
ExampleObtain the fault tree tree1 and export it to
tree1.json:adoctor faultree --action get --tree_list tree1 --export tree1.json --access_token tokenDelete fault tree tree1:
adoctor faultree --action delete --tree_list tree1 --access_token token
Diagnosis Operations
Note: Before performing fault diagnosis, ensure that the two services of the diagnosis module are started properly and are properly connected to the Kafka cluster.
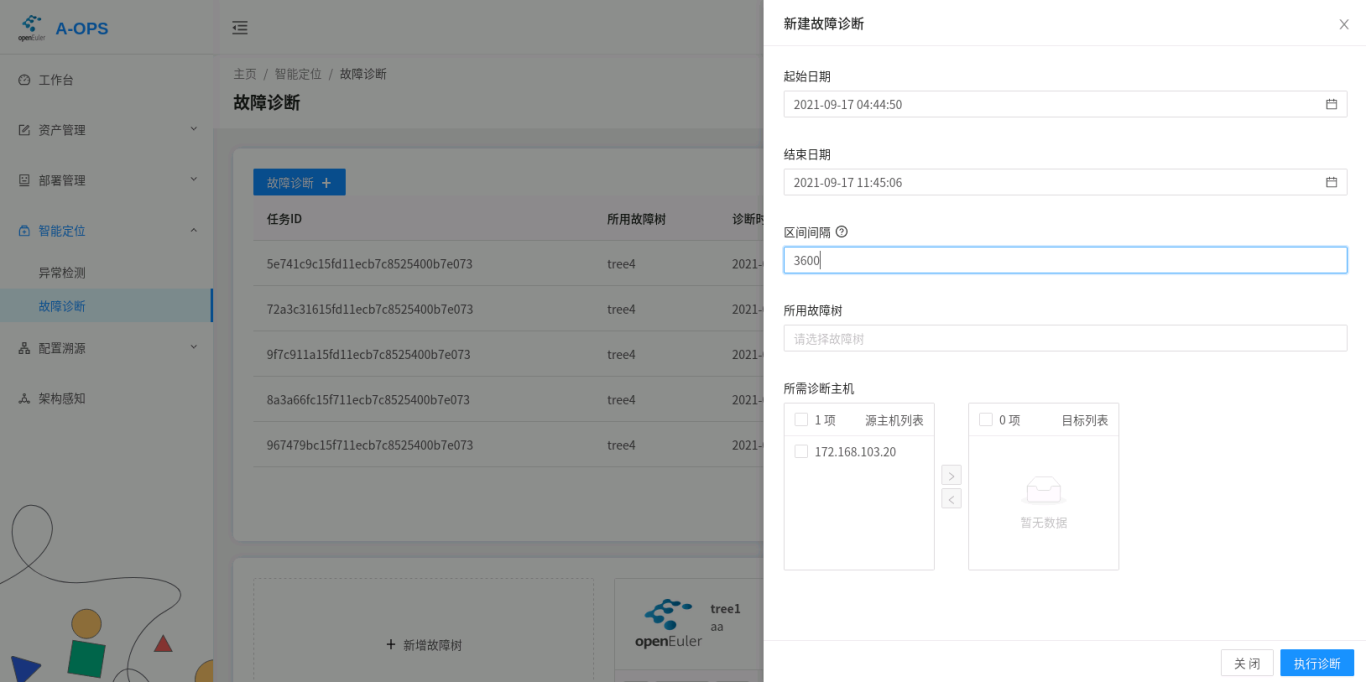
Performing Diagnosis.
To perform the diagnosis, you need to set the following four parameters:
- ID of the host to be diagnosed.
- Diagnosis tree used for diagnosis.
- Time range of the diagnosis.
- Diagnosis interval, in seconds.
The diagnosis interval is used to slice a large time range to perform diagnosis for multiple times on each slices.
Web:
CLI:
adoctor diag [--tree_list] [list] [--host_list] [list] [--start] [time1] [--end] [time2] [--interval] [int] [--access_token] [token]Mandatory parameters--access_tokenAccess Token.
--tree_listSpecifies the fault tree. Multiple fault trees are separated by commas (,). The value cannot be empty.
--host_listSpecifies the IDs of the hosts to be diagnosed. The IDs are separated by commas (,) and cannot be empty.
--startSpecifies the start time of the fault diagnosis.
--endSpecifies the end time of the fault diagnosis.--intervalSpecifies the time interval of the fault diagnosis.
ExamplePerform fault diagnosis on host1 based on tree1.
adoctor diag --tree_list tree1 --host_list host1 --start 20210908-11:11:11 --end 20210908-12:11:11 --interval 1800 --access_token token
Diagnosis Task Operations
Viewing the Diagnosis Task List.
Web: On the main page of Fault Diagnosis, you can view the task list and select a task to view it.
CLI:
After the diagnosis is performed, the CLI returns the ID of the diagnosis task. Currently, you can not use the CLI to query the task list based on the user ID.
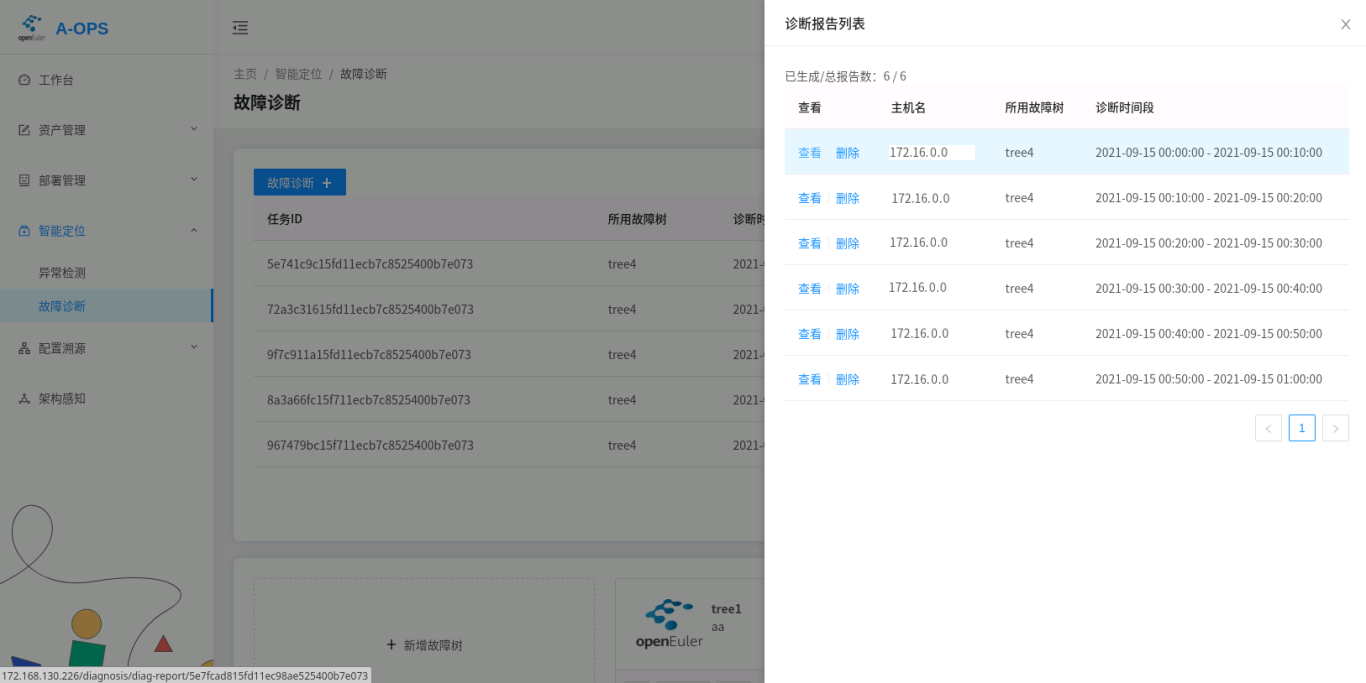
Viewing and Deleting Diagnosis Reports.
Web: You can open the page of a diagnosis task and select a report to view it.
The following figure shows the diagnosis list.
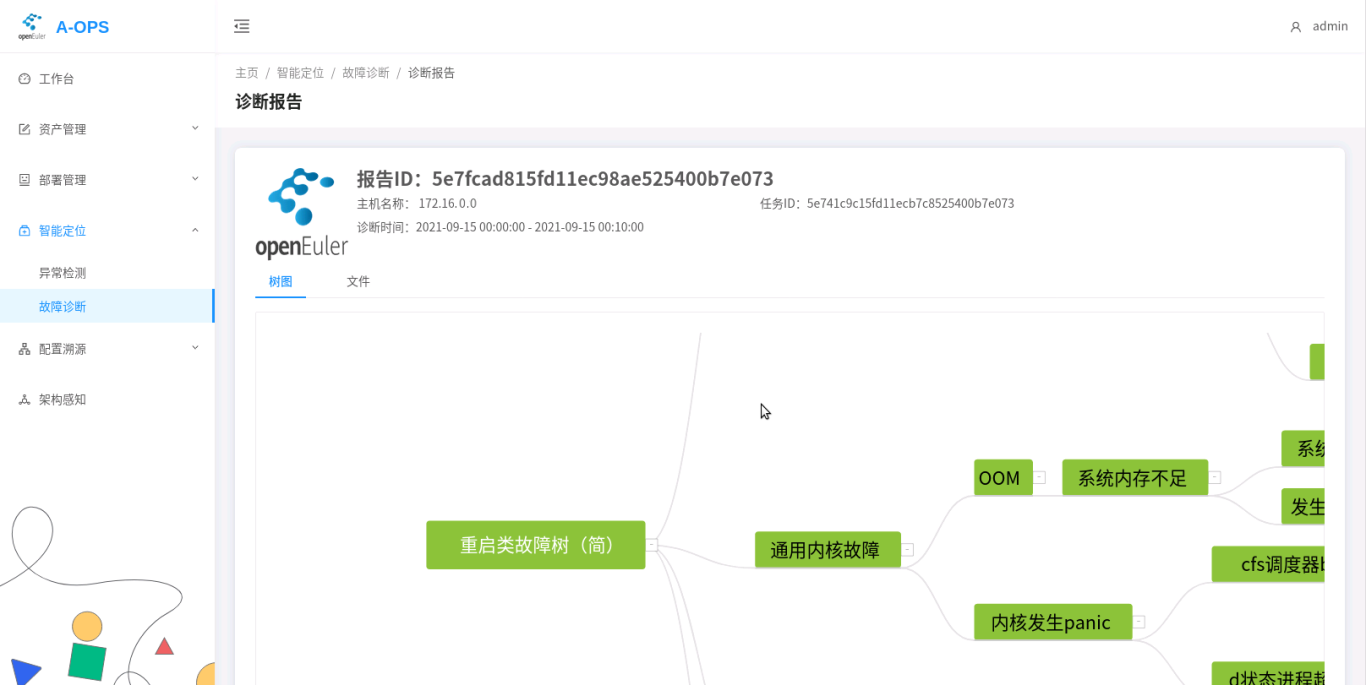
The diagnosis report is as follows:
CLI:
adoctor report [--action] [action] [--tree_list] [tree1] [--host_list] [list] [--start] [time1] [--end] [time2] [--report_list] [id1,id2] [--task_id] [id]Mandatory parameters--actionget indicates that the report is obtained, and delete indicates that the report is deleted.
--access_tokenAccess Token.
Optional parameters--tree_listSpecifies the fault tree, which is separated by commas (,). If report_id and task_id are not specified, this parameter is used for query.
--host_listSpecifies the IDs of the hosts to be diagnosed. The IDs are separated by commas (,). If report_id and task_id are not specified, the system queries the hosts based on the IDs.
--startSpecifies the start time of fault diagnosis.
--endSpecifies the end time of fault diagnosis.--task_idYou can query the report based on the task ID. If this parameter is specified, the report is queried based only on this parameter.
--report_listReport ID list, which is used for querying and deleting detailed reports.
Example:
Delete a specified report.
aops report --action delete --report_list r1,r2 --access_token tokenObtaining the Diagnosis Report List of a Specified Host in a Specified Tree
aops report --action get --tree_list tree1,tree2 --host_list id1,id2 --start xxx --end xx --access_token tokenQuery the report list based on the task ID.
aops report --action get --task_id id1 --access_token tokenQuery report details based on the report ID.
aops report --action get --report_list id1,id2 --access_token token
Log viewing
There are two types of diagnosis module logs. The scheduler logs are recorded in /var/log/aops/uwsgi/diag_scheduler.log, and the executor logs are recorded in /var/log/aops.log. The log dump configuration is stored in the /etc/aops/system.ini file, which is the unified log configuration of aops.
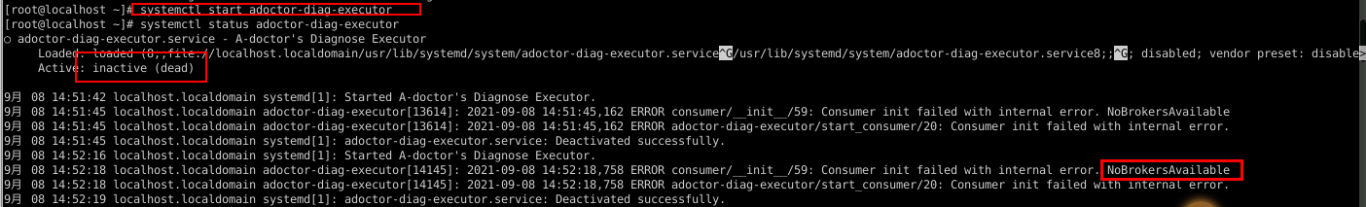
FAQ
The diagnosis executor fails to be started, and the message "NoBrokerAvailable." is displayed.
This error is reported because the executor fails to connect to Kafka. Check whether Kafka is started properly and whether the kafka_server_list parameter in the executor configuration file correctly specifies the Kafka address.
The diagnosis scheduler also encounters the same problem. However, the Kafka producer is not directly created when the diagnosis scheduler is started. The Kafka producer is created only after the diagnosis command is triggered. Therefore, you need to view the command output or service logs after the diagnosis to check whether the connection to Kafka is normal.
Bug CatchingopenEuler is an open source project incubated and operated by the OpenAtom Foundation.

Licensed under the MulanPSL2
Copyright © 2025 openEuler. All rights reserved. J. ICP B. No. 2020036654-1
 J.G.W.A.B. No. 11030102011597

openEuler公众号


openEuler小助手
cancel