System Resources and Performance
CPU
Basic Concepts
A central processing unit (CPU) is one of main devices of a computer, and a function of the CPU is to interpret computer instructions and process data in computer software.
- Physical core: an actual CPU core that can be seen. It has independent circuit components and L1 and L2 caches and can independently execute instructions. A CPU can have multiple physical cores.
- Logical core: a core that exists at the logical layer in the same physical core. Generally, a physical core corresponds to a thread. However, if hyper-threading is enabled and the number of hyper-threads is n, a physical core can be divided into n logical cores. You can run the lscpu command to check the number of CPUs on the server, the number of physical cores in each CPU, and the number of logical cores in each CPU.
Demarcation and Locating
Common CPU Performance Analysis Tools
uptime: prints the average system load. The last three numbers indicate the average load within the last one, five, and fifteen minutes. If the average load is greater than the number of CPUs, the CPUs are insufficient to serve threads and some threads are waiting. If the average load is less than the number of CPUs, there are remaining CPUs.

vmstat: dynamically monitors the usage of system resources and checks which phase occupies the most system resources. You can run the vmstat -h command to view command parameters. Example:
# Monitor the status and update the status every second. vmstat 1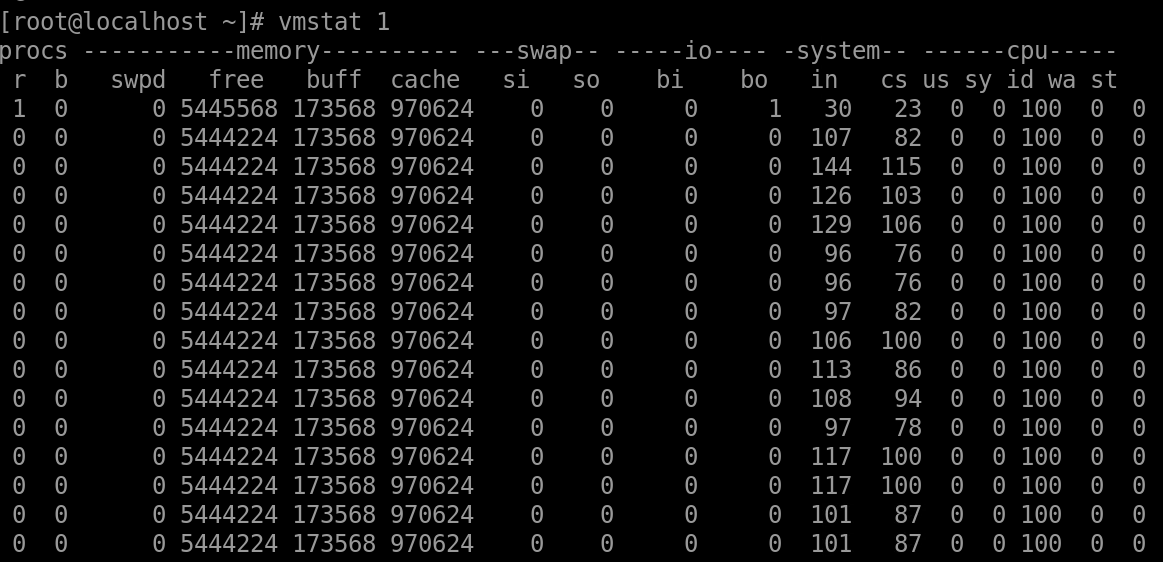 The fields in the command output are described as follows:
Field Description procs Process information. memory Memory information. swap Swap partition information. io Drive read/write information. system System information. cpu CPU information.
-us: percentage of the CPU computing time consumed by non-kernel processes.
-sy: percentage of the CPU computing time consumed by kernel processes.
-id: idle.
-wa: percentage of CPU resources consumed by waiting for I/Os.
-st: percentage of CPUs stolen by VMs.sar: analyzes system performance, observes current activities and configurations, and archives and reports historical statistics. Example:
# Check the overall CPU load of the system. Collect the statistics every 3 seconds for five times.
sar -u 3 5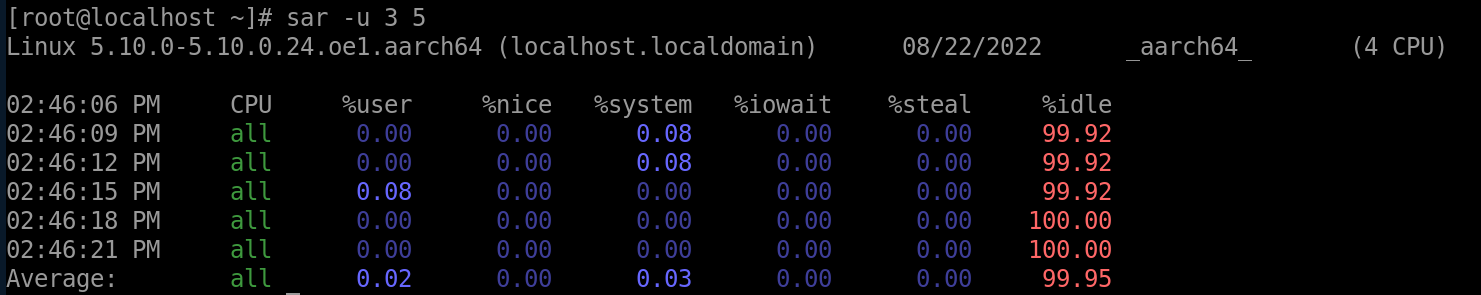
The fields in the command output are described as follows:
Field Description %user Percentage of the CPU time consumed in user mode. %nice Percentage of the CPU time consumed by a process whose scheduling priority is changed through nice in user mode. %system Percentage of the CPU time consumed in system mode. %iowait Percentage of the time consumed by the CPU to wait for drive I/Os in idle state. %steal Percentage of the time used for waiting for other virtual CPU computing by using virtualization technologies of the OS. %idle Percentage of CPU idle time. ps: displays running processes.
# View all processes in the system, and view the PIDs and priorities of the their parent processes.
ps -le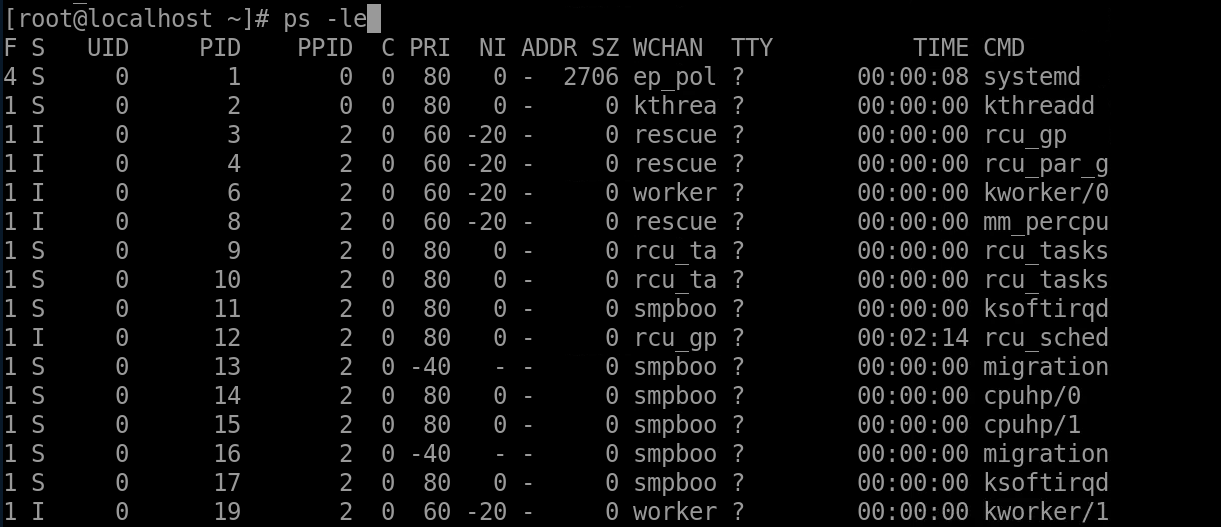
# View the processes generated by the current shell.
ps -l
top: dynamically and continuously monitors the running status of processes and displays the processes that consume the most CPU resources.
top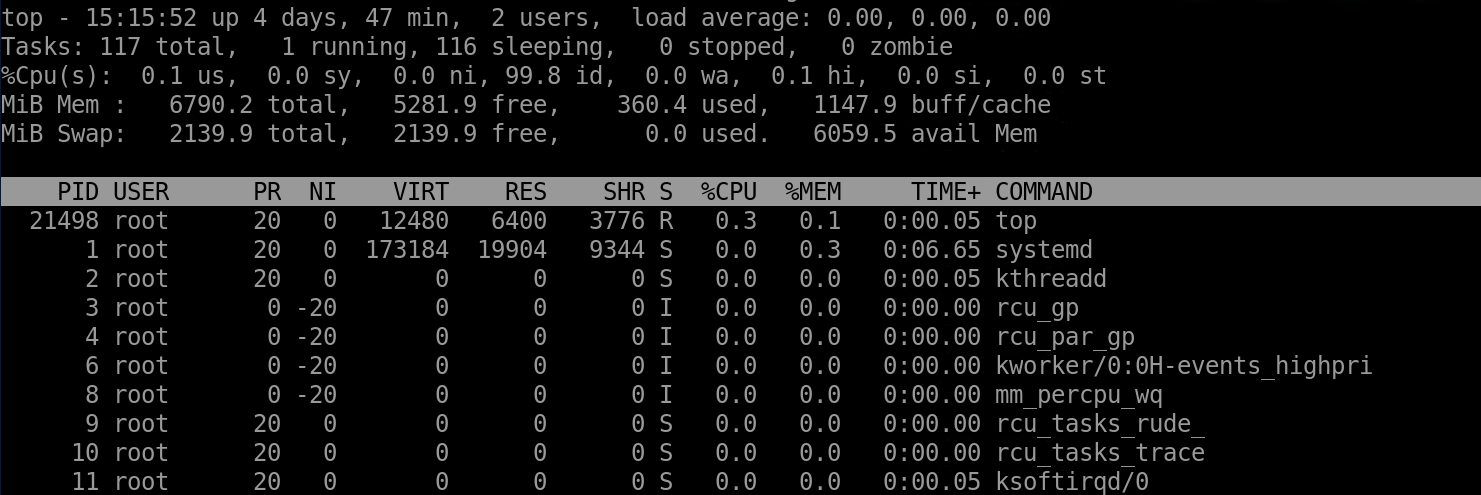
Memory
Basic Concepts
The memory is an important component of a computer, and is used to temporarily store operation data in the CPU and data exchanged with an external memory such as hardware. In particular, a non-uniform memory access architecture (NUMA) is a memory architecture designed for a multiprocessor computer. The memory access time depends on the location of the memory relative to the processor. In NUMA mode, a processor accesses the local memory faster than the non-local memory (the memory is located in another processor or shared between processors).
Demarcation and Locating
Common Memory Analysis Tools and Methods
free: displays the system memory status. Example:
# Display the system memory status in MB.
free -m
The fields in the command output are described as follows:
Field Description total Total memory size. used Used memory. free Free memory. shared Total memory shared by multiple processes. buff/cache Total number of buffers and caches. available Estimated available memory to start a new application without swapping. vmstat: dynamically monitors the system memory and views the system memory usage.
Example:
# Monitor the system memory and display active and inactive memory.
vmstat -a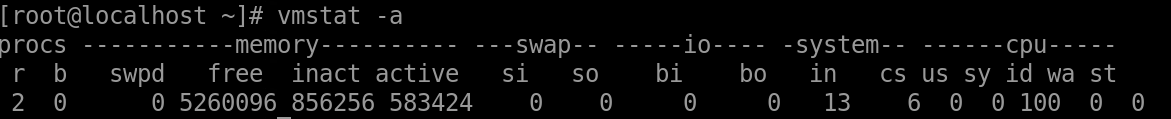
In the command output, the field related to the memory is described as follows:
Field Description memory Memory information.
-swpd: usage of the virtual memory, in KB.
-free: free memory capacity, in KB.
-inact: inactive memory capacity, in KB.
-active: active memory capacity, in KB.sar: monitors the memory usage of the system.
Example:
# Monitor the memory usage in the sampling period in the system. Collect the statistics every two seconds for three times.
sar -r 2 3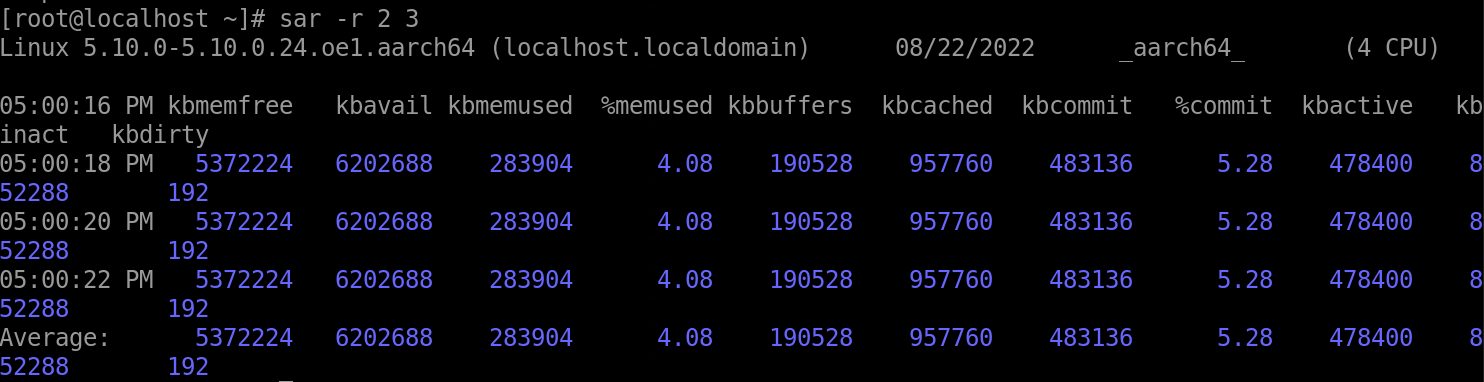
The fields in the command output are described as follows:
Field Description kbmemfree Unused memory space. kbmemused Used memory space. %memused Percentage of the used space. kbbuffers Amount of data stored in the buffer. kbcached Data access volume in all domains of the system. numactl: displays the NUMA node configuration and status.
Example:
# Check the current NUMA configuration.
numactl -H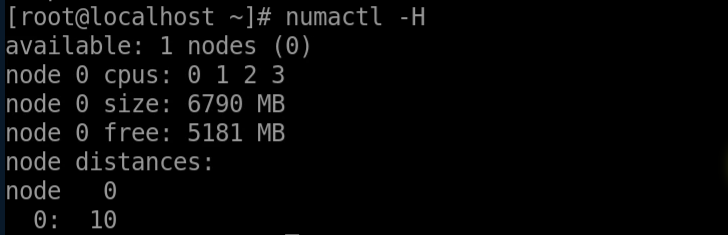
The server contains one NUMA node. The NUMA node that contains four cores and 6 GB memory. The command also displays the distance between NUMA nodes. The further the distance, the higher the latency of cross-node memory accesses, which should be avoided as much as possible.
numstat: displays NUMA node status.
# Check the NUMA node status.
numastat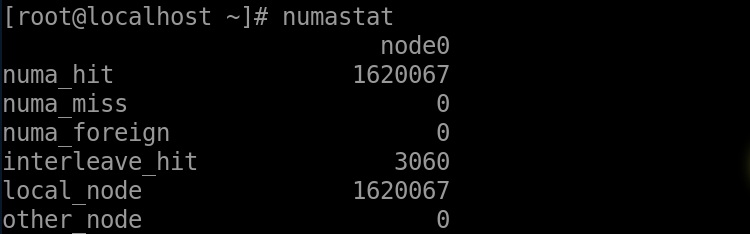
The fields in the numastat command output are described as follows:
Field Description numa_hit Number of times that the CPU core accesses the local memory on a node. numa_miss Number of times that the core of a node accesses the memory of other nodes. numa_foreign Number of pages that were allocated to the local node but moved to other nodes. Each numa_foreign corresponds to a numa_miss event. interleave_hit Number of pages of the interleave policy that are allocated to this node. local_node Size of memory that was allocated to this node by processes on this node. other_node Size of memory that was allocated to other nodes by processes on this node.
I/O
Basic Concepts
I/O indicates input/output. Input refers to the operation of receiving signals or data by the system, and output refers to the operation of sending signals or data from the system. For a combination of CPU and main memory, any information incoming to or outgoing from the CPU/memory combination is considered as I/Os.
Demarcation and Locating
Common I/O Performance Analysis Tools
iostat: reports statistics about all online drives.
Example:
# Display the drive information in KB. Collect the statistics every 100 seconds until you press Ctrl+C.
iostat -d -k -x 100
# Display the drive information in KB. Collect the statistics every second and for 100 seconds.
iostat -d -k -x 1 100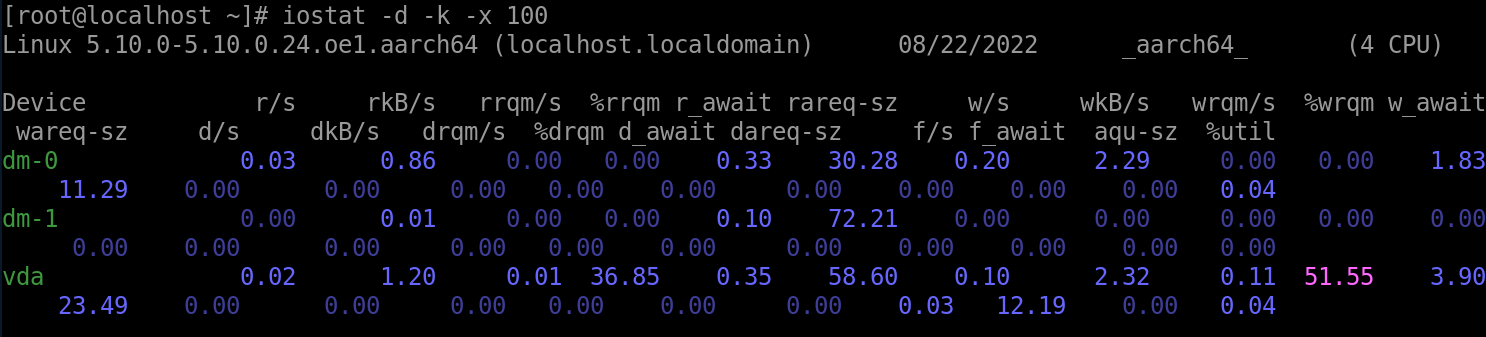
The fields in the command output are described as follows:
Field Description Device Name of the monitoring device. r/s Number of read requests completed by the device per second (after combination). rKB/s Number of KBs read from the drive per second. rrqm/s Number of read operations merged into the request queue per second. %rrqm Percentage of read requests merged before they are sent to the device. r_await Average time consumed by each read request. rareq-sz Average size of read requests sent to the device, in KB. w/s Number of write requests completed by the device per second (after combination). wKB/s Number of KBs written to the drive per second. wrqm/s Number of write operations merged into the request queue per second. %wrqm Percentage of write requests merged before they are sent to the device. w_await Average time consumed by each write request. wareq-sz Average size of write requests sent to the device, in KB. d/s Number of discard requests processed by the device per second. dKB/s Number of sectors (KB) discarded by the device per second. drqm/s Number of discard requests merged into the device queue per second. %drqm Percentage of discard requests merged before they are sent to the device. d_await Average time for sending discard requests to the device to be served. dareq-sz Average size of discard requests sent to the device, in KB. f/s Number of refresh requests completed by the device per second (after combination). f_await Average time for sending refresh requests to the device to be served. aqu-sz Average queue length of requests sent to the device. %util Percentage of the I/O operation time, that is, the usage. sar: displays the read and write performance of the system drive.
Example:
# Display the usage status of all hard drives in the system in the sampling period. Collect the statistics every 3 seconds for five times.
sar -d 3 5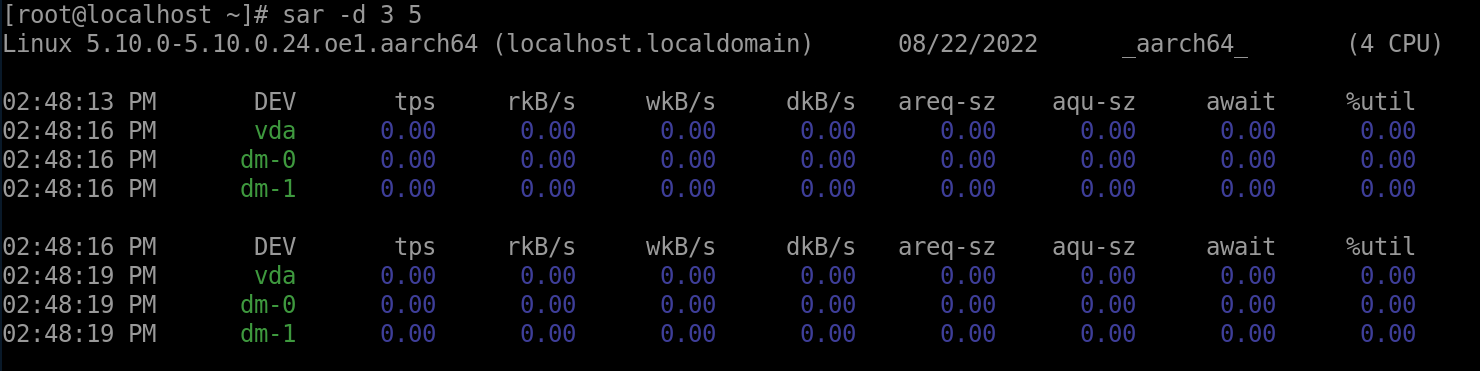
The fields in the command output are described as follows:
Field Description tps Total number of transfers sent to the physical device per second. rKB/s Number of KBs read from the device per second. wKB/s Number of KBs written to the device per second. dKB/s Number of KBs discarded by the device per second. areq-sz Average size (KB) of I/O requests sent to the device. aqu-sz Average queue length of requests sent to the device. await Average time for sending I/O requests to the device to be served. %util Percentage of the time used to send I/O requests to the device (bandwidth usage of the device). vmstat
# Run the vmstat command to monitor and report drive statistics.
vmstat -d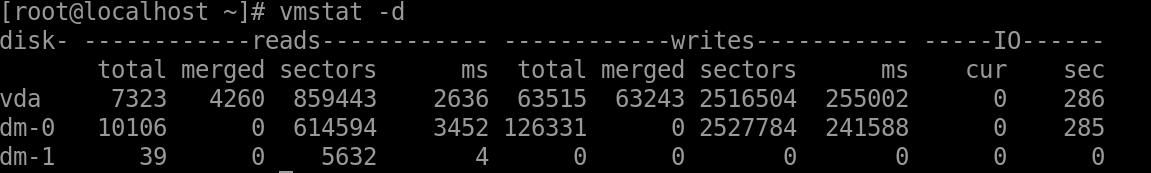
The fields in the command output are described as follows:
Field Description reads -total: total number of reads that have been successfully completed.
-merged: number of merged reads (resulting in one I/O).
-sectors: sectors from which data is successfully read.
-ms: number of milliseconds spent on reading data.writes -total: total number of writes that have been successfully completed.
-merged: merged writes (resulting in one I/O).
-sectors: sectors to which data is successfully written.
-ms: number of milliseconds spent on writing data.IO Drive read/write information.
-bi: total amount of data read from the block device, in blocks.
-bo: total amount of data written to the block device, in blocks.