Using gala-gopher
As a data collection module, gala-gopher provides OS-level monitoring capabilities, supports dynamic probe installation and uninstallation, and integrates third-party probes in a non-intrusive manner to quickly expand the monitoring scope.
This chapter describes how to deploy and use the gala-gopher service.
Installation
Mount the repo sources.
[oe-2209]      # openEuler 22.09 officially released repository
name=oe2209
baseurl=http://119.3.219.20:82/openEuler:/22.09/standard_x86_64
enabled=1
gpgcheck=0
priority=1

[oe-2209:Epol] # openEuler 22.09: Epol officially released repository
name=oe2209_epol
baseurl=http://119.3.219.20:82/openEuler:/22.09:/Epol/standard_x86_64/
enabled=1
gpgcheck=0
priority=1
Install gala-gopher.
yum install gala-gopher
Configuration
Configuration Description
The configuration file of gala-gopher is /opt/gala-gopher/gala-gopher.conf. The configuration items in the file are described as follows (the parts that do not need to be manually configured are not described):
The following configurations can be modified as required:
global: gala-gopher global configuration information.log_directory: gala-gopher log file name.pin_path: path for storing the map shared by the eBPF probe. You are advised to retain the default value.
metric: metric output mode.out_channel: metric output channel. The value can beweb_serverorkafka. If this parameter is left empty, the output channel is disabled.kafka_topic: topic configuration information if the output channel is Kafka.
event: output mode of abnormal events.out_channel: event output channel. The value can belogsorkafka. If this parameter is left empty, the output channel is disabled.kafka_topic: topic configuration information if the output channel is Kafka.
meta: metadata output mode.out_channel: metadata output channel. The value can belogsorkafka. If this parameter is left empty, the output channel is disabled.kafka_topic: topic configuration information if the output channel is Kafka.
imdb: cache specification configuration.max_tables_num: maximum number of cache tables. In the /opt/gala-gopher/meta directory, each meta corresponds to a table.max_records_num: maximum number of records in each cache table. Generally, each probe generates at least one observation record in an observation period.max_metrics_num: maximum number of metrics contained in each observation record.record_timeout: aging time of the cache table. If a record in the cache table is not updated within the aging time, the record is deleted. The unit is second.
web_server: configuration of the web_server output channel.port: listening port.
kafka: configuration of the Kafka output channel.kafka_broker: IP address and port number of the Kafka server.
logs: configuration of the logs output channel.metric_dir: path for storing metric data logs.event_dir: path for storing abnormal event data logs.meta_dir: metadata log path.debug_dir: path of gala-gopher run logs.
probes: native probe configuration.name: probe name, which must be the same as the native probe name. For example, the name of the example.probe probe is example.param: probe startup parameters. For details about the supported parameters, see Startup Parameters.switch: whether to start a probe. The value can beonoroff.
extend_probes: third-party probe configuration.name: probe name.command: command for starting a probe.param: probe startup parameters. For details about the supported parameters, see Startup Parameters.start_check: Ifswitchis set toauto, the system determines whether to start the probe based on the execution result ofstart_check.switch: whether to start a probe. The value can beon,off, orauto. The valueautodetermines whether to start the probe based on the result ofstart_check.
Startup Parameters
| Parameter | Description |
|---|---|
| -l | Whether to enable the function of reporting abnormal events. |
| -t | Sampling period, in seconds. By default, the probe reports data every 5 seconds. |
| -T | Delay threshold, in ms. The default value is 0. |
| -J | Jitter threshold, in ms. The default value is 0. |
| -O | Offline time threshold, in ms. The default value is 0. |
| -D | Packet loss threshold. The default value is 0. |
| -F | If this parameter is set to task, data is filtered by task_whitelist.conf. If this parameter is set to the PID of a process, only the process is monitored. |
| -P | Range of probe programs loaded to each probe. Currently, the tcpprobe and taskprobe probes are involved. |
| -U | Resource usage threshold (upper limit). The default value is 0 (%). |
| -L | Resource usage threshold (lower limit). The default value is 0 (%). |
| -c | Whether the probe (TCP) identifies client_port. The default value is 0 (no). |
| -N | Name of the observation process of the specified probe (ksliprobe). The default value is NULL. |
| -p | Binary file path of the process to be observed, for example, nginx_probe. You can run -p /user/local/sbin/nginx to specify the Nginx file path. The default value is NULL. |
| -w | Filtering scope of monitored applications, for example, -w /opt/gala-gopher/task_whitelist.conf. You can write the names of the applications to be monitored to the task_whitelist.conf file. The default value is NULL, indicating that the applications are not filtered. |
| -n | NIC to mount tc eBPF. The default value is NULL, indicating that all NICs are mounted. Example: -n eth0 |
Configuration File Example
Select the data output channels.
metric =
{
    out_channel = "web_server";
    kafka_topic = "gala_gopher";
};

event =
{
    out_channel = "kafka";
    kafka_topic = "gala_gopher_event";
};

meta =
{
    out_channel = "kafka";
    kafka_topic = "gala_gopher_metadata";
};
Configure Kafka and Web Server.
web_server =
{
    port = 8888;
};

kafka =
{
    kafka_broker = "<Kafka server IP address>:9092";
};
Select the probe to be enabled. The following is an example.
probes =
(
    {
        name = "system_infos";
        param = "-t 5 -w /opt/gala-gopher/task_whitelist.conf -l warn -U 80";
        switch = "on";
    },
);
extend_probes =
(
    {
        name = "tcp";
        command = "/opt/gala-gopher/extend_probes/tcpprobe";
        param = "-l warn -c 1 -P 7";
        switch = "on";
    }
);
Start
After the configuration is complete, start gala-gopher.
systemctl start gala-gopher.service
Query the status of the gala-gopher service.
systemctl status gala-gopher.service
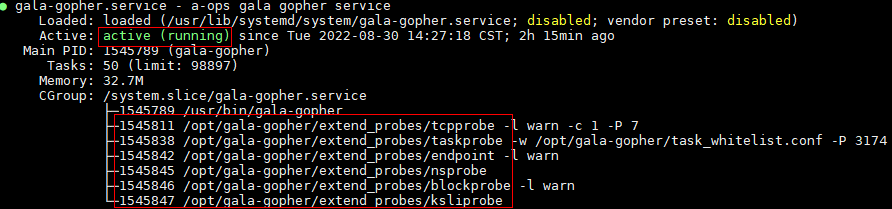
If the following information is displayed, the service is started successfully: Check whether the enabled probe is started. If the probe thread does not exist, check the configuration file and gala-gopher run log file.
Note: The root permission is required for deploying and running gala-gopher.
How to Use
Deployment of External Dependent Software
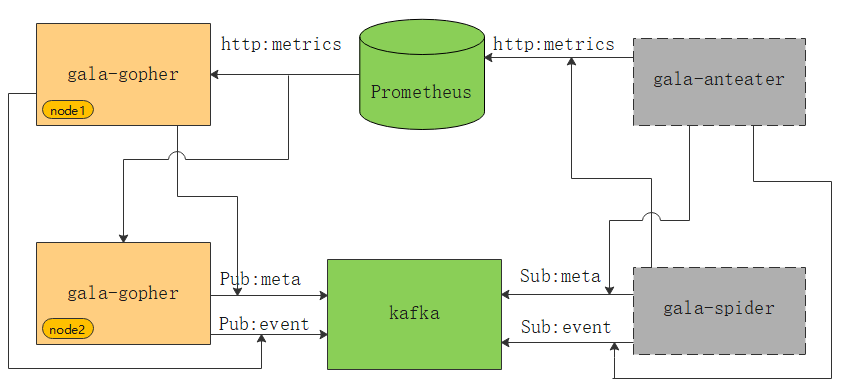
As shown in the preceding figure, the green parts are external dependent components of gala-gopher. gala-gopher outputs metric data to Prometheus, metadata and abnormal events to Kafka. gala-anteater and gala-spider in gray rectangles obtain data from Prometheus and Kafka.
Note: Obtain the installation packages of Kafka and Prometheus from the official websites.
Output Data
Metric
Prometheus Server has a built-in Express Browser UI. You can use PromQL statements to query metric data. For details, see Using the expression browser in the official document. The following is an example.
If the specified metric is
gala_gopher_tcp_link_rcv_rtt, the metric data displayed on the UI is as follows:gala_gopher_tcp_link_rcv_rtt{client_ip="x.x.x.165",client_port="1234",hostname="openEuler",instance="x.x.x.172:8888",job="prometheus",machine_id="1fd3774xx",protocol="2",role="0",server_ip="x.x.x.172",server_port="3742",tgid="1516"} 1Metadata
You can directly consume data from the Kafka topic
gala_gopher_metadata. The following is an example.$ Input request ./bin/kafka-console-consumer.sh --bootstrap-server x.x.x.165:9092 --topic gala_gopher_metadata $ Output data {"timestamp": 1655888408000, "meta_name": "thread", "entity_name": "thread", "version": "1.0.0", "keys": ["machine_id", "pid"], "labels": ["hostname", "tgid", "comm", "major", "minor"], "metrics": ["fork_count", "task_io_wait_time_us", "task_io_count", "task_io_time_us", "task_hang_count"]}Abnormal events
You can directly consume data from the Kafka topic
gala_gopher_event. The following is an example.$ Input request ./bin/kafka-console-consumer.sh --bootstrap-server x.x.x.165:9092 --topic gala_gopher_event $ Output data {"timestamp": 1655888408000, "meta_name": "thread", "entity_name": "thread", "version": "1.0.0", "keys": ["machine_id", "pid"], "labels": ["hostname", "tgid", "comm", "major", "minor"], "metrics": ["fork_count", "task_io_wait_time_us", "task_io_count", "task_io_time_us", "task_hang_count"]}