Commonly Used Tools
ftrace
- ftrace: a debug tool for the Linux kernel space. The kernel provides trace events for you to trace . ftrace can capture events so that you can intuitively view these events and trace kernel functions.
- Configuration and usage of ftrace: To use ftrace, you need to compile its dependencies into the kernel. By default, openEuler compiles the ftrace option. If the ftrace option is not enabled, you can enable it by choosing Kernel hacking > Tracers > Trace syscalls in menuconfig. In addition, you need to compile the debugfs by choosing Kernel hacking > Generic Kernel Debugging Instruments > Debug Filesystem.
- Configuring the ftrace function
ftrace provides access interfaces for user space through the debugfs. After the debugfs is configured in the kernel, the /sys/kernel/debug directory is created. The debugfs is mounted to this directory. If the kernel supports ftrace-related configuration items, a tracing directory is created in the debugfs. The debugfs is mounted to this directory. The following figure shows the content of this directory.
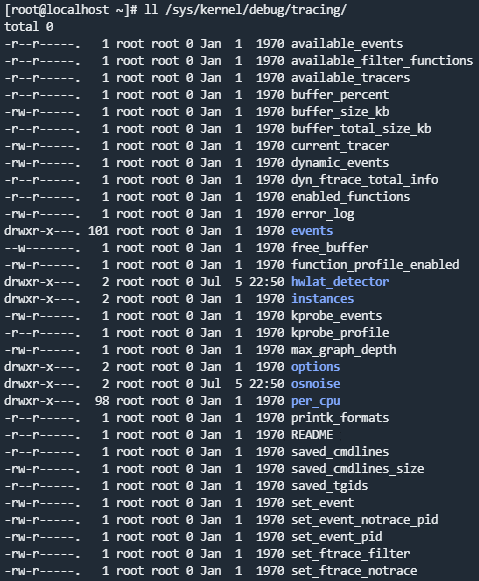
Introduction to the ftrace debugfs interface
You can view some control and output files provided by ftrace through the debugfs. The common files are described as follows:
available_tracers: available tracers

current_tracer: running tracer

available_events: lists all available trace events in the OS

events: This directory differentiates events by module.

set_event: lists the events to be traced.

tracing_on: enables or disables tracing. echo 0 > tracing_on indicates that tracing is disabled, and 1 indicates that tracing is enabled.

trace: queries trace data.
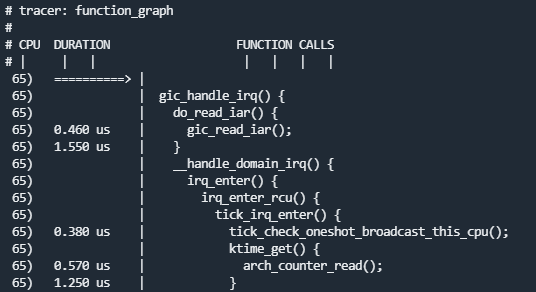
- Available tracers

function: a function call tracing program that does not require parameters
function_graph: a function call tracer that uses subcalls
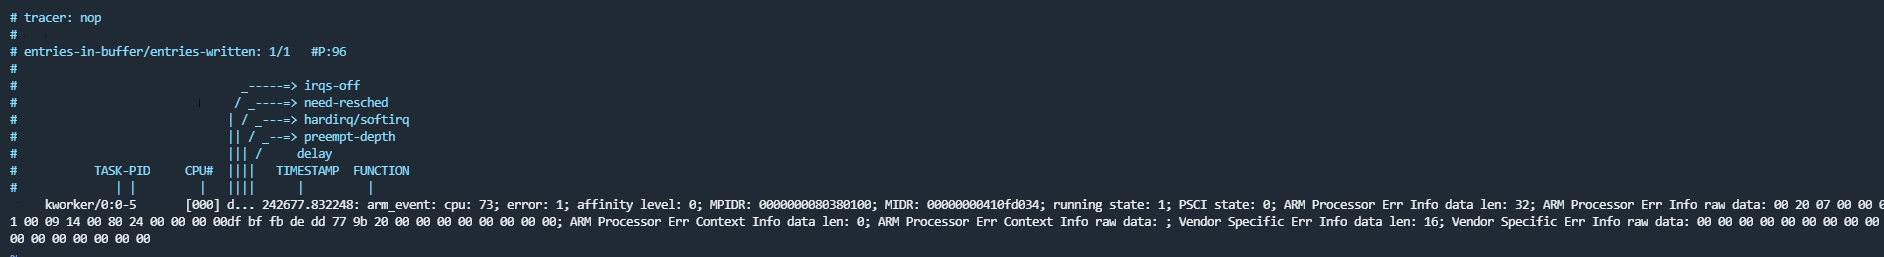
- Trace events
# Specify the arm_event of the RAS to be traced.
echo ras:arm_event > /sys/kernel/debug/tracing/set_event

# This file contains the event format and fields to be printed.
cat /sys/kernel/debug/tracing/events/ras/arm_event/format

# Start tracing.
echo 1 > /sys/kernel/debug/tracing/tracing_on

#  Observe the trace output.
tail -f /sys/kernel/debug/tracing/trace
- Tracing input parameters of kernel functions
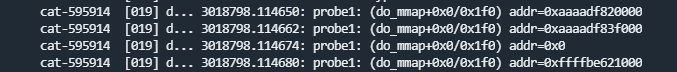
Trace mmap, which corresponds to the system call do_mmap. Output the addr input parameter.
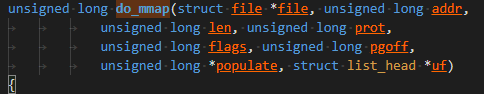
# Trace through the kprobe.
echo 'p:probe1 do_mmap addr=%x1' > kprobe_events

# Enable kprobe.
echo 1 > events/kprobes/probe1/enable

# Start tracing.
echo 1 > tracing_on

# View trace data.
- Tracing function calls
# Select a tracing type.
echo function_graph > current_tracer

# Set the PID of the process to be filtered.
echo <pid> set_ftrace_pid

# Start tracing.
echo 1 > tracing_on

# View trace data.
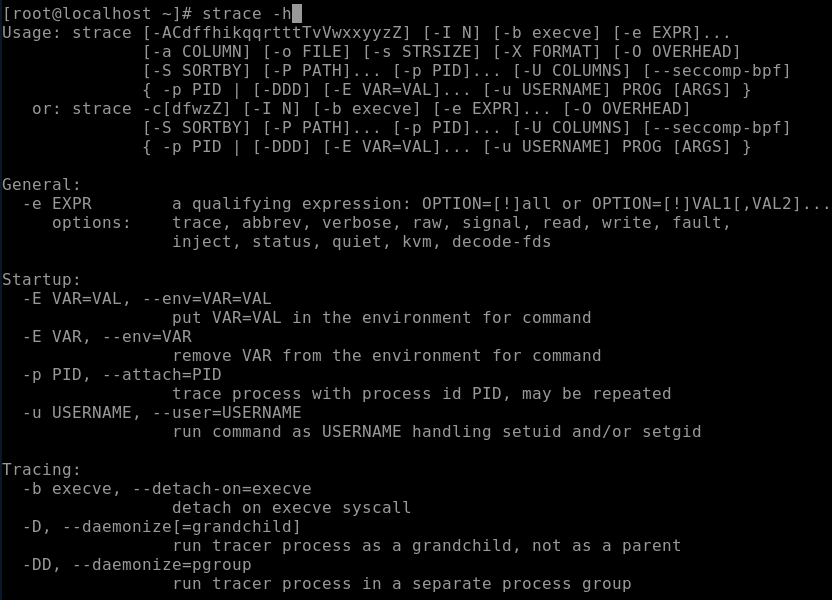
strace
The strace command is a diagnosis and debugging tool. You can use the strace command to analyze system calls and signal transmission of applications to solve problems or understand the application execution process.
You can run the strace -h command to view the functions provided by strace.
The most common usage is to trace the xx command, trace the forks, print the time, and output the result to the output file.
strace -f -tt -o output xx
kdump
- crash/kdump Principles
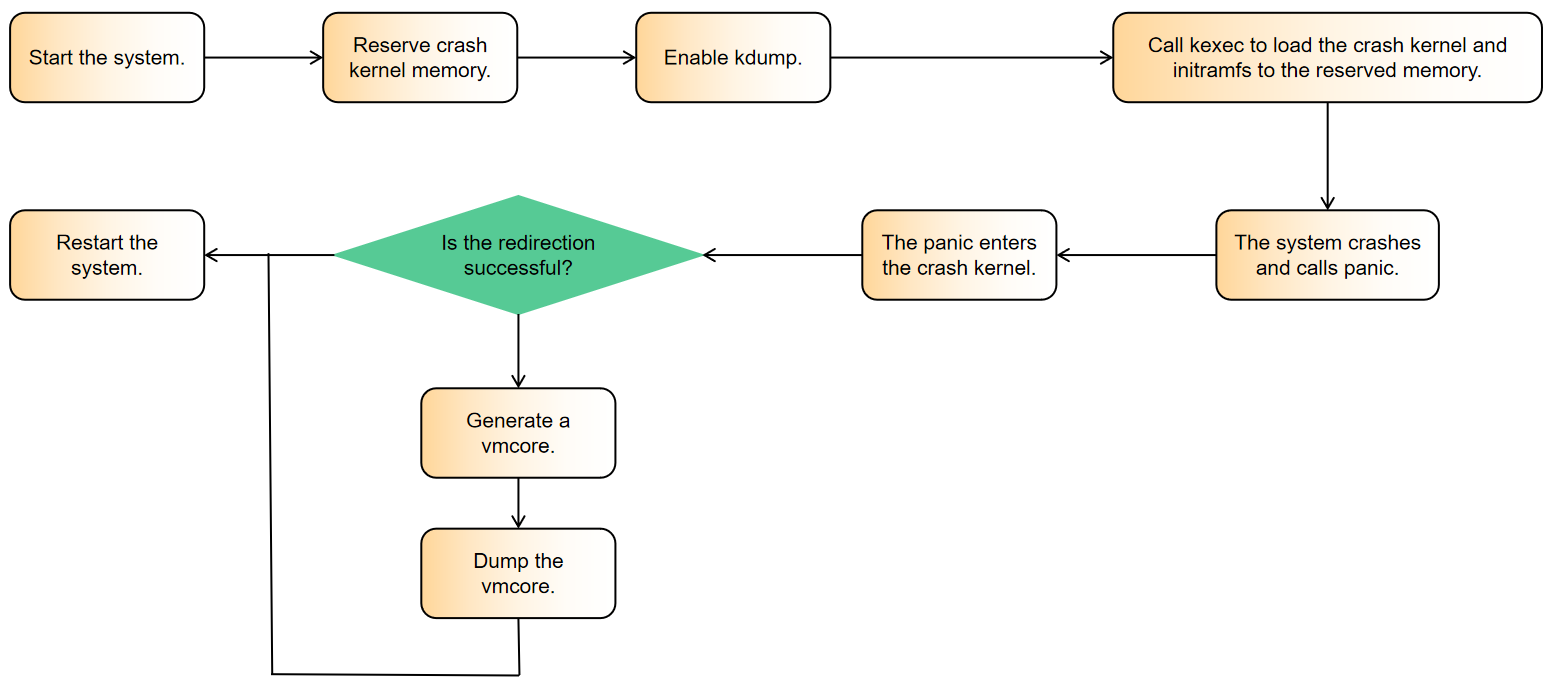
kdump is a snapshot of the memory status of the OS running at a certain time point. It helps O&M personnel debug and analyze the cause of system breakdown. kdump is usually used when system breakdown and panic happen.
The procedure is as follows.
- Installing and configuring related tools
# Use Yum to install the corresponding software package.
yum install kernel-debuginfo-$(uname -r) kexec-tools crash -y
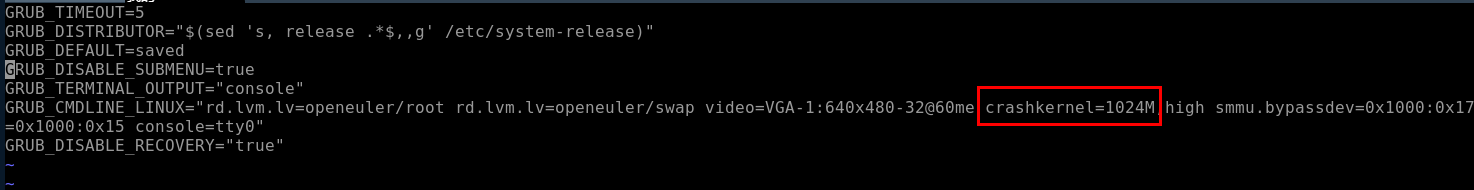
# Set the reserved memory size for **crashkernel**.
vim /etc/default/grub
# Regenerate the grub configuration file.
grub2-mkconfig -o /boot/efi/EFI/openEuler/grub.cfg
reboot

# Start the kdump service.
systemctl start kdump #Start kdump.
systemctl enable kdump #Set the kdump to start upon system startup.
- Triggering a crash
Operation 1 Retain the default settings of the kernel. When a hard lock or oops occurs, a panic is triggered.
Operation 2 Modify the settings. The following commands cam make the settings take effect only once and become invalid after the system is restarted.
# Set a soft lock to trigger a panic.
echo 1 > /proc/sys/kernel/softlockup_panic

# Trigger a kernel panic when an out of memory (OOM) error occurs.
echo 1 > /proc/sys/vm/panic_on_oom

# A panic occurs when a process is hung.
echo 1 > /proc/sys/kernel/hung_task_panic

# Set the timeout interval of the hung task mechanism.
echo 60 > /proc/sys/kernel/kernel.hung_task_timeout_secs
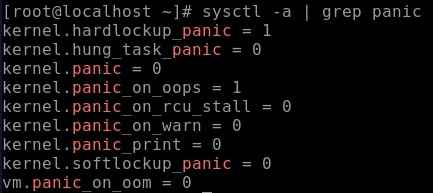
Operation 3 To make the configuration take effect permanently, write the following parameters to the /etc/sysctl.conf file and run the sysctl -p command:
kernel.hung_task_panic=1
kernel.hung_task_timeout_secs=60
kernel.softlockup_panic=1
vm.panic_on_oom=1
- Analyzing the crash
Operation 1 Enable crash debugging.
Operation 2 Find the generated vmcore file generated in the /var/crash directory.
Operation 3 Run the following command to start crash debugging:
crash {vmcore file} {debug kernel vmlinux}
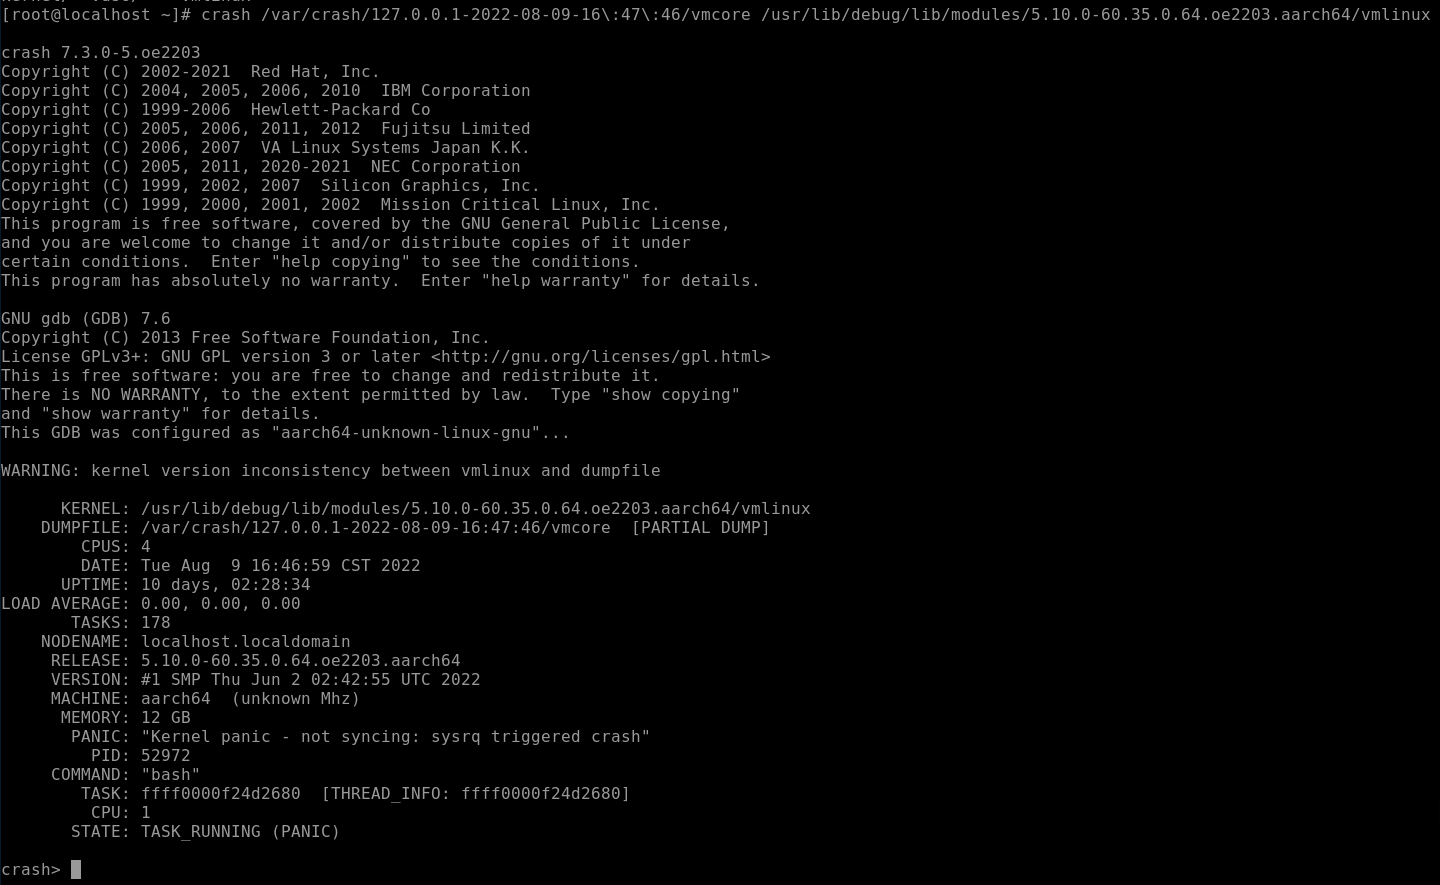
The format of the crash debugging command is command args. command indicates the command to be executed, and args indicates the parameters required by some debugging commands.
| Command | Description |
|---|---|
| help | Prints the help information of a command. You can view the supported commands or the help information of a specific command. For example, run help bt. |
| bt | Prints the function call stack information. |
| log | Prints the system message buffer. Parameters can be appended, for example, log. |
| ps | Displays the process status. > indicates that the process is active. |
| dis | Disassembles a specified function or address. Example: **dis -l [func |
| mount | Displays information about the current file system. |