Hardware Tuning
Configuring BIOS
Purpose
You can set some advanced configuration options in the BIOS for different server hardware devices to improve server performance.
Method
This method applies to Kunpeng servers. For x86 servers, such as Intel servers, you can retain the default BIOS configurations.
Disable the SMMU (only for the Kunpeng server).
During the server restart, press Delete to access the BIOS, choose Advanced > MISC Config, and press Enter.
Set Support Smmu to Disable.
Note: Disable the SMMU feature only in non-virtualization scenarios. In virtualization scenarios, enable the SMMU.
Disable prefetch.
On the BIOS, choose Advanced > MISC Config and press Enter.
Set CPU Prefetching Configuration to Disabled and press F10.
Creating RAID 0
Purpose
A RAID array can improve the overall storage and access performance of drives. If an LSI SAS3108, LSI SAS3408, or LSI SAS3508 RAID controller card is used, you are advised to create a single-drive RAID 0 array or a RAID 5 array to fully use the RAID controller card cache (which is 2 GB for the LSI SAS3508 RAID controller) and increase the read/write speed.
Method
Use the storcli64_arm file to check the RAID group creation.
./storcli64_arm /c0 showNote: You can download the storcli64_arm file from the following URL and run it in any directory: https://docs.broadcom.com/docs/007.1507.0000.0000_Unified_StorCLI.zip.
Create a RAID 0 array. In the following example, the command is used to create a RAID 0 array for the second 1.2 TB drive. c0 indicates the ID of the RAID controller card, and r0 indicates RAID 0. Perform this operation on all drives except the system drive.
./storcli64_arm /c0 add vd r0 drives=65:1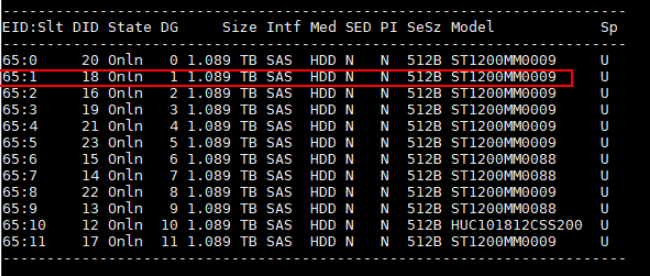
Enabling the RAID Controller Card Cache
Purpose
Use RAWBC (without a supercapacitor) or RWBC (with a supercapacitor) with a RAID controller card to provide better performance.
Use the storcli tool to modify the cache settings of the RAID array. Set Read Policy to Read ahead to use the cache of the RAID controller card for prefetch. Set Write Policy to Write back to use the cache of the RAID controller card for write back instead of write through. Set IO policy to Cached IO to use the cache of the RAID controller card to cache I/Os.
Method
- Configure the cache of the RAID controller card. In the command, vx indicates the volume group number (v0, v1, and v2, etc.). Set vx based on the environment requirements.
./storcli64_arm /c0/vx set rdcache=RA
./storcli64_arm /c0/vx set wrcache=WB/AWB
./storcli64_arm /c0/vx set iopolicy=Cached
- Check whether the configuration has taken effect.
./storcli64_arm /c0 show
Adjusting rx_buff
Purpose
Take the 1822 NIC as an example. The default value of rx_buff is 2 KB. When 64 KB packets are aggregated, multiple discontinuous memory fragments are required, resulting in low utilization. This parameter can be set to 2, 4, 8, or 16 KB. After the value is changed, discontinuous memory can be reduced and the memory utilization is improved.
Method
Check the value of rx_buff. The default value is 2.
cat /sys/bus/pci/drivers/hinic/module/parameters/rx_buffAdd the hinic.conf file to the /etc/modprobe.d/ directory and change the value of rx_buff to 8.
options hinic rx_buff=8Mount the HiNIC driver again for the new parameters to take effect.
rmmod hinic
modprobe hinic
Check whether the rx_buff parameter is updated successfully.
cat /sys/bus/pci/drivers/hinic/module/parameters/rx_buff
Adjusting the Ring Buffer
Purpose
Take the 1822 NIC as an example. The maximum ring buffer size of the NIC is 4096. The default value is 1024. You can increase the size of the ring buffer.
Method
Check the default size of the ring buffer. Assume that the current NIC is named enp131s0.
ethtool -g enp131s0Change the value of Ring Buffer to 4096.
ethtool -G enp131s0 rx 4096 tx 4096Confirm that the ring buffer value has been updated.
ethtool -g enp131s0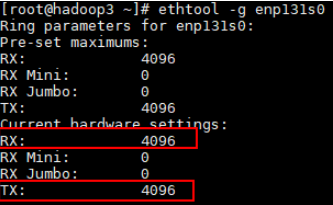
Reduce the quantity of queues.
ethtool -L enp131s0 combined 4
ethtool -l enp131s0
Enabling LRO
Purpose
Take the 1822 NIC as an example. The NIC supports large receive offload (LRO). You can enable this function and set the LRO parameter of the 1822 properly.
Method
Check whether the value of the LRO parameter is set to on. The default value is off. Assume that the current NIC is named enp131s0.
ethtool -k enp131s0Enable LRO.
ethtool -K enp131s0 lro onCheck whether the value of the LRO parameter is set to on.
ethtool -k enp131s0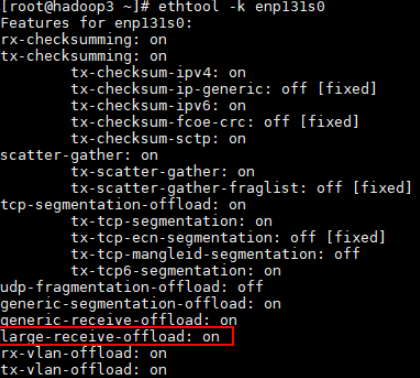
Binding NIC Interrupts to Cores
Purpose
To help the service network improve the capability of receiving and sending packets, binding cores manually to fix interrupts is a better option than using irqbalance of the kernel to schedule NIC interrupts on all cores.
Method
Disable irqbalance.
Before binding cores to NICs, disable irqbalance.
Run the following command:
systemctl stop irqbalance.service # (Stop irqbalance. The setting will be invalid after the system restarts.)
systemctl disable irqbalance.service # (Disable irqbalance. The setting takes effect permanently.)
systemctl status irqbalance.service # (Check whether the irqbalance service is disabled.)
Check the PCI device number of the NIC. Assume that the current NIC is named enp131s0.
ethtool -i enp131s0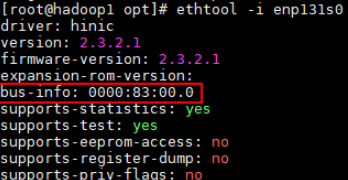
Check the NUMA node to which the PCIe NIC connects.
lspci -vvvs <bus-info>
Check the core range corresponding to the NUMA node. For example, for the Kunpeng 920 5250 processor, the core range can be 48 to 63.
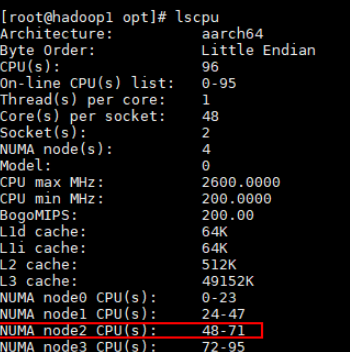
Bind interrupts to cores. The Hi1822 NIC has 16 queues. Bind the interrupts to the 16 cores of the NUMA node to which the NIC connect (for example, cores 48 to 63 corresponding to NUMA node 1).
bash smartIrq.shThe script content is as follows:
#!/bin/bash
irq_list=(`cat /proc/interrupts | grep enp131s0 | awk -F: '{print $1}'`)
cpunum=48  # Change the value to the first core of the node.
for irq in ${irq_list[@]}
do
echo $cpunum > /proc/irq/$irq/smp_affinity_list
echo `cat /proc/irq/$irq/smp_affinity_list`
(( cpunum+=1 ))
done
Check whether the core binding is successful.
sh irqCheck.sh enp131s0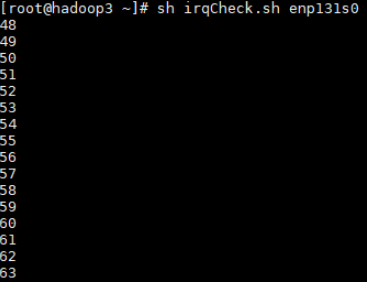
The script content is as follows:
#!/bin/bash
# NIC name
intf=$1
log=irqSet-`date "+%Y%m%d-%H%M%S"`.log
# Number of available CPUs
cpuNum=$(cat /proc/cpuinfo |grep processor -c)
# RX and TX interrupt lists
irqListRx=$(cat /proc/interrupts | grep ${intf} | awk -F':' '{print $1}')
irqListTx=$(cat /proc/interrupts | grep ${intf} | awk -F':' '{print $1}')
# Bind the RX interrupt requests (IRQs).
for irqRX in ${irqListRx[@]}
do
	cat /proc/irq/${irqRX}/smp_affinity_list
done
# Bind the TX IRQs.
for irqTX in ${irqListTx[@]}
do
	cat /proc/irq/${irqTX}/smp_affinity_list
done
OS Tuning
Disabling the Transparent Huge Page
Purpose
Disable the transparent huge page (THP) to prevent memory leak and reduce lag.
Method
Disable the THP.
echo never > /sys/kernel/mm/transparent_hugepage/enabled
echo never > /sys/kernel/mm/transparent_hugepage/defrag
Disabling the Swap Partition
Purpose
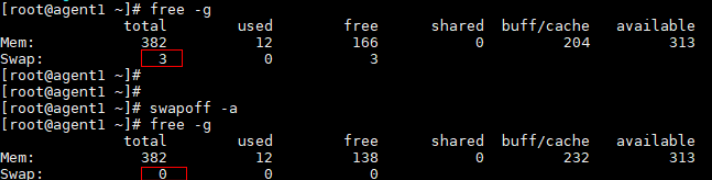
The virtual memory of the Linux OS is automatically adjusted based on the system load. Swapping memory pages to the swap partition of drives affects the test performance.
Method
swapoff -a
Comparison before and after the modification
Spark Tuning
Tuning I/O Configuration Items
I/O queue adjustment
- Purpose
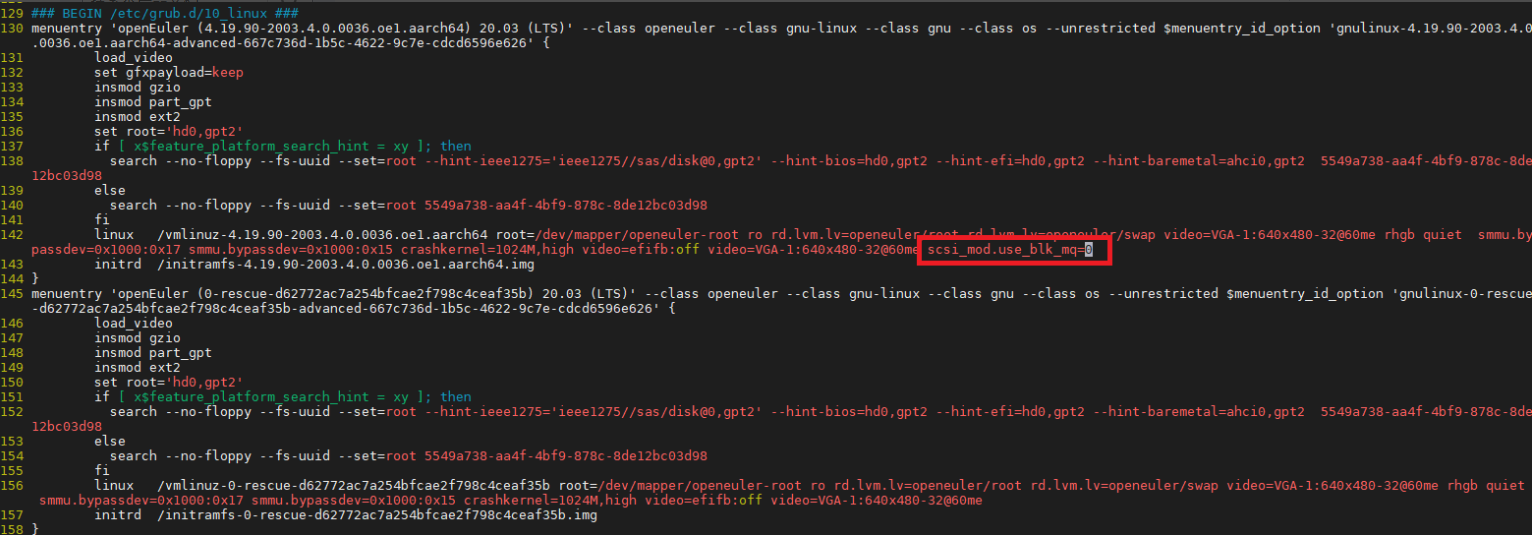
Use the single-queue (soft queue) mode for better performance during Spark tests.
- Method
Add scsi_mod.use_blk_mq=0 to the kernel startup command line in /etc/grub2-efi.cfg and restart the system for the modification to take effect.
Kernel I/O parameter configuration
#! /bin/bash

echo 3000 > /proc/sys/vm/dirty_expire_centisecs
echo 500 > /proc/sys/vm/dirty_writeback_centisecs

echo 15000000 > /proc/sys/kernel/sched_wakeup_granularity_ns
echo 10000000 > /proc/sys/kernel/sched_min_granularity_ns

systemctl start tuned
sysctl -w kernel.sched_autogroup_enabled=0
sysctl -w kernel.numa_balancing=0

echo 11264 > /proc/sys/vm/min_free_kbytes
echo 60 > /proc/sys/vm/dirty_ratio
echo 5 > /proc/sys/vm/dirty_background_ratio

list="b c d e f g h i j k l m" # Modify as required.
for i in $list
do
  echo 1024 > /sys/block/sd$i/queue/max_sectors_kb
  echo 32 > /sys/block/sd$i/device/queue_depth
  echo 256 > /sys/block/sd$i/queue/nr_requests
  echo mq-deadline > /sys/block/sd$i/queue/scheduler
  echo 2048 > /sys/block/sd$i/queue/read_ahead_kb
  echo 2 > /sys/block/sd$i/queue/rq_affinity
  echo 0 > /sys/block/sd$i/queue/nomerges
done
Adapting JVM Parameters and Version
Purpose
The latest JDK version optimizes the Spark performance.
Method
Add the following configurations to the spark-defaults.conf file to use the new JDK parameters:
spark.executorEnv.JAVA_HOME /usr/local/jdk8u222-b10
spark.yarn.appMasterEnv.JAVA_HOME /usr/local/jdk8u222-b10
spark.executor.extraJavaOptions -XX:+UseNUMA -XX:BoxTypeCachedMax=100000
spark.yarn.am.extraJavaOptions -XX:+UseNUMA -XX:BoxTypeCachedMax=100000
Note: In the x86 architecture, the JVM parameter -XX:BoxTypeCachedMax is not applicable.
Tuning Spark Application Parameters
Purpose
Based on the basic Spark configuration values, obtain a group of executor parameters using the theoretical formula to boost the performance of Kunpeng-powered servers.
Method
If you use Spark-Test-Tool to test SQL 1 to SQL 10, open the script/spark-default.conf file in the tool directory and add the following configuration items:
yarn.executor.num 15
yarn.executor.cores 19
spark.executor.memory 44G
spark.driver.memory 36G
If you use HiBench to test the WordCount, TeraSort, Bayesian, and k-means scenarios, open the conf/spark.conf file in the tool directory and adjust the number of running cores and memory size based on the actual environment.
yarn.executor.num 15
yarn.executor.cores 19
spark.executor.memory 44G
spark.driver.memory 36G
Tuning Items for Dedicated Scenarios
SQL Scenario
I/O-Intensive Scenario: SQL 1
Purpose
SQL 1 is an I/O-intensive scenario. You can tune I/O parameters for the optimal performance.
Method
Set the following I/O parameters. sd$i indicates the names of all drives that are tested.
echo 128 > /sys/block/sd$i/queue/nr_requests
echo 512 > /sys/block/sd$i/queue/read_ahead_kb
Set the parameters of dirty pages in the memory.
/proc/sys/vm/vm.dirty_expire_centisecs  500
/proc/sys/vm/vm.dirty_writeback_centisecs   100
Set the degree of parallelism is in Spark-Test-Tool/script/spark-default.conf.
spark.sql.shuffle.partitions 350
spark.default.parallelism 580
In this scenario, set other parameters to the general tuning values in Tuning Spark Application Parameters.
CPU-Intensive Scenarios: SQL 2 & SQL 7
Purpose
SQL 2 and SQL 7 are CPU-intensive scenarios. You can tune Spark executor parameters for the optimal performance.
Method
Based on the actual environment, adjust the number of running cores and memory size specified by Spark-Test-Tool in the script/spark-default.conf file to achieve the optimal performance. For example, for the Kunpeng 920 5220 processor, the following executor parameters are recommended for SQL 2 and SQL 7.
yarn.executor.num 42
yarn.executor.cores 6
spark.executor.memory 15G
spark.driver.memory 36G
Set the degree of parallelism is in Spark-Test-Tool/script/spark-default.conf.
For SQL 2, set the parameters as follows:
spark.sql.shuffle.partitions 150
spark.default.parallelism 504
For SQL 7, set the parameters as follows:
spark.sql.shuffle.partitions 300
spark.default.parallelism 504
I/O- and CPU-Intensive Scenario: SQL 3
Purpose
SQL 3 is an I/O- and CPU-intensive scenario. You can tune Spark executor parameters and adjust I/O parameters for the optimal performance.
Method
Based on the actual environment, adjust the number of running cores and memory size specified by Spark-Test-Tool in the script/spark-default.conf file to achieve the optimal performance. For example, for the Kunpeng 920 5220 processor, the following executor parameters are recommended for SQL 3.
yarn.executor.num 30
yarn.executor.cores 6
spark.executor.memory 24G
spark.driver.memory 36G
Adjust the I/O prefetch value. sd$i indicates the names of all Spark drives.
echo 4096 > /sys/block/sd$i/queue/read_ahead_kbSet the degree of parallelism is in Spark-Test-Tool/script/spark-default.conf.
spark.sql.shuffle.partitions 150
spark.default.parallelism 360
CPU-Intensive Scenario: SQL 4
Purpose
SQL 4 is a CPU-intensive scenario. You can tune Spark executor parameters and adjust I/O parameters for the optimal performance.
Method
Based on the actual environment, adjust the number of running cores and memory size specified by Spark-Test-Tool in the script/spark-default.conf file to achieve the optimal performance. For example, for the Kunpeng 920 5220 processor, the following executor parameters are recommended for SQL 4.
Open the script/spark-default.conf file in the tool directory and add the following configuration items:
yarn.executor.num 42
yarn.executor.cores 6
spark.executor.memory 15G
spark.driver.memory 36G
Adjust the I/O prefetch value. sd$i indicates the names of all Spark drives.
echo 4096 > /sys/block/sd$i/queue/read_ahead_kbSet the degree of parallelism is in Spark-Test-Tool/script/spark-default.conf.
spark.sql.shuffle.partitions 150
spark.default.parallelism 504
SQL 5, SQL 6, SQL 8, SQL 9, SQL 10
Set the degree of parallelism is in Spark-Test-Tool/script/spark-default.conf.
spark.sql.shuffle.partitions 300
spark.default.parallelism 504
In this scenario, set other parameters to the general tuning values in Tuning Spark Application Parameters.
HiBench Scenario
I/O- and CPU-Intensive Scenario: WordCount
Purpose
WordCount is an I/O- and CPU-intensive scenario, where the mq-deadline algorithm and I/O parameter adjustment can deliver higher performance than that of the single-queue deadline scheduling algorithm.
Method
Modify the following configurations. sd$i indicates the names of all drives that are tested.
echo mq-deadline > /sys/block/sd$i/queue/scheduler
echo 512 > /sys/block/sd$i/queue/nr_requests
echo 8192 > /sys/block/sd$i/queue/read_ahead_kb
echo 500 > /proc/sys/vm/dirty_expire_centisecs
echo 100 > /proc/sys/vm/dirty_writeback_centisecs
echo 5 > /proc/sys/vm/dirty_background_ratio
In this scenario, you can set the quantity of partitions and parallelism to three to five times of the total cluster core quantity for data sharding. This reduces the size of a single task file for better performance. You can use the following shard settings:
spark.sql.shuffle.partitions 300
spark.default.parallelism 600
Based on the actual environment, adjust the number of running cores and memory size specified by HiBench in the configuration file to achieve the optimal performance. For example, for the Kunpeng 920 5220 processor, the following executor parameters are recommended for WordCount.
yarn.executor.num 51
yarn.executor.cores 6
spark.executor.memory 13G
spark.driver.memory 36G
I/O- and CPU-Intensive Scenario: TeraSort
Purpose
TeraSort is an I/O- and CPU-intensive scenario. You can adjust I/O parameters and Spark executor parameters for the optimal performance. In addition, TeraSort requires high network bandwidth. You can tune network parameters to improve system performance.
Method
Modify the following configurations. sd$i indicates the names of all drives that are tested.
echo bfq > /sys/block/sd$i/queue/scheduler
echo 512 > /sys/block/sd$i/queue/nr_requests
echo 8192 > /sys/block/sd$i/queue/read_ahead_kb
echo 4 > /sys/block/sd$i/queue/iosched/slice_idle
echo 500 > /proc/sys/vm/dirty_expire_centisecs
echo 100 > /proc/sys/vm/dirty_writeback_centisecs
In this scenario, you can set the quantity of partitions and parallelism to three to five times of the total cluster core quantity for data sharding. This reduces the size of a single task file for better performance. Open the conf/spark.conf file of HiBench and use the following shard settings:
spark.sql.shuffle.partitions 1000
spark.default.parallelism 2000
Open the conf/spark.conf file of HiBench and add the following executor parameters:
yarn.executor.num 27
yarn.executor.cores 7
spark.executor.memory 25G
spark.driver.memory 36G
Tune network parameters.
ethtool -K enp131s0 gro on
ethtool -K enp131s0 tso on
ethtool -K enp131s0 gso on
ethtool -G enp131s0 rx 4096 tx 4096
ethtool -G enp131s0 rx 4096 tx 4096
# The TM 280 NIC supports a maximum of 9,000 MTUs.
ifconfig enp131s0 mtu 9000 up
CPU-Intensive Scenario: Bayesian
Purpose
Bayesian is a CPU-intensive scenario. You can adjust I/O parameters and Spark executor parameters for the optimal performance.
Method
You can use the following shard settings:
spark.sql.shuffle.partitions 1000
spark.default.parallelism 2500
Open the conf/spark.conf file of HiBench and add the following executor parameters:
yarn.executor.num 9
yarn.executor.cores 25
spark.executor.memory 73G
spark.driver.memory 36G
Use the following kernel parameters:
echo mq-deadline > /sys/block/sd$i/queue/scheduler
echo 0 > /sys/module/scsi_mod/parameters/use_blk_mq
echo 50 > /proc/sys/vm/dirty_background_ratio
echo 80 > /proc/sys/vm/dirty_ratio
echo 500 > /proc/sys/vm/dirty_expire_centisecs
echo 100 > /proc/sys/vm/dirty_writeback_centisecs
Compute-Intensive Scenario: k-means
Purpose
k-means is a CPU-intensive scenario. You can adjust I/O parameters and Spark executor parameters for the optimal performance.
Method
Adjust the Spark executor parameters to proper values. In this scenario, you can use the following shard settings:
spark.sql.shuffle.partitions 1000
spark.default.parallelism 2500
Adjust the I/O prefetch value. sd$i indicates the names of all Spark drives.
echo 4096 > /sys/block/sd$i/queue/read_ahead_kbOpen the conf/spark.conf file of HiBench and add the following executor parameters:
yarn.executor.num 42
yarn.executor.cores 6
spark.executor.memory 15G
spark.driver.memory 36G
spark.locality.wait 10s
Tuning Hive
Tuning I/O Configuration Items
The scheduler, read_ahead_kb, and sector_size configurations are involved.
You are advised to use mq-deadline as the scheduler to achieve higher I/O efficiency and improve performance.
It is recommended that the prefetch size of a block device be set to 4 MB to achieve better read performance. The default value is 128 KB.
The sector_size of a block device must match the sector size of the physical drive. The hw_sector_size, max_hw_sectors_kb, and max_sectors_kb parameters can be used for matching. The values of the first two parameters are read from the hardware, and the value of the third parameter is the maximum aggregation block size of the kernel block device. It is recommended that the value of the third parameter be the same as that of the hardware. That is, the values of the latter two parameters should be the same.
Set the parameters for all involved data drives as follows:
list="b c d e f g h i j k l m" # Modify as required.
for i in $list
do
  echo mq-deadline > /sys/block/sd$i/queue/scheduler
  echo 4096 > /sys/block/sd$i/queue/read_ahead_kb
  echo 512 > sys/block/sd$i/queue/hw_sector_size
  echo 1024 > /sys/block/sd$i/queue/max_hw_sectors_kb
  echo 256 > /sys/block/sd$i/queue/max_sectors_kb
done
Tuning Dirty Page Parameters
echo 500 > /proc/sys/vm/dirty_expire_centisecs
echo 100 > /proc/sys/vm/dirty_writeback_centisecs
Hive Tuning
Configuring Component Parameters
| Component | Parameter | Recommended Value | Reason for Change |
|---|---|---|---|
| Yarn->NodeManager Yarn->ResourceManager | ResourceManager Java heap size | 1024 | Increase the JVM memory size to reduce the GC frequency. Remarks: The values are not fixed. You need to increase or decrease the values of Xms and Xmx based on the GC release status. |
| Yarn->NodeManager Yarn->ResourceManager | NodeManager Java heap size | 1024 | |
| Yarn->NodeManager | yarn.nodemanager.resource.cpu-vcores | Same as the actual total number of physical cores of the DataNode | Number of CPU cores that can be allocated to a container. |
| Yarn->NodeManager | yarn.nodemanager.resource.memory-mb | Same as the actual physical memory capacity of the DataNode | Memory that can be allocated to a container. |
| Yarn->NodeManager | yarn.nodemanager.numa-awareness.enabled | true | NUMA awareness when NodeManager starts a container, which needs to be manually added. |
| Yarn->NodeManager | yarn.nodemanager.numa-awareness.read-topology | true | Automatic NUMA topology awareness of NodeManager, which needs to be manually added. |
| MapReduce2 | mapreduce.map.memory.mb | 7168 | Maximum memory that can be used by a map task. |
| MapReduce2 | mapreduce.reduce.memory.mb | 14336 | Maximum memory that can be used by a reduce task. |
| MapReduce2 | mapreduce.job.reduce.slowstart.completedmaps | 0.35 | Only if the map completion ratio reaches the value of this parameter, the system allocates resources to reduce. |
| HDFS->NameNode | NameNode Java heap size | 3072 | Increase the JVM memory size to reduce the GC frequency. |
| HDFS->NameNode | NameNode new generation size | 384 | |
| HDFS->NameNode | NameNode maximum new generation size | 384 | |
| HDFS->NameNode | dfs.namenode.service.handler.count | 32 | Number of threads used by the NameNode RPC server to monitor DataNode requests and other requests. You can increase the value as required. |
| HDFS->NameNode | dfs.namenode.handler.count | 1200 | Number of threads used by the NameNode RPC server to monitor client requests. You can increase the value as required. |
| HDFS->DataNode | dfs.datanode.handler.count | 512 | Number of DataNode service threads. You can increase the value as required. |
| TEZ | tez.am.resource.memory.mb | 7168 | This parameter is equivalent to yarn.scheduler.minimum-allocation-mb. The default value is 7168. |
| TEZ | tez.runtime.io.sort.mb | SQL1: 32 SQL2: 256 SQL3: 256 SQL4: 128 SQL5: 64 | Adjust the value of this parameter based on different scenarios. |
| TEZ | tez.am.container.reuse.enabled | true | Container reuse switch. |
| TEZ | tez.runtime.unordered.output.buffer.size-mb | 537 | 10% x Value of hive.tez.container.size |
| TEZ | tez.am.resource.cpu.vcores | 10 | Number of used virtual CPUs. The default value is 1. You need to manually add this parameter. |
| TEZ | tez.container.max.java.heap.fraction | 0.85 | Percentage of memory allocated to the Java process against the memory provided by Yarn. The default value is 0.8. You need to manually add this parameter. |
Enabling the NUMA Feature
Yarn 3.1.0 allows NUMA awareness to be enabled when the container is started. The principle is to read the CPU core and memory capacity of each NUMA node on the physical nodes. You can use the numactl command to specify the CPU range and membind range for starting the container and reduce cross-chip access.
- Install numactl.
yum install numactl.aarch64
- Enable NUMA awareness.
yarn.nodemanager.numa-awareness.enabled          true
yarn.nodemanager.numa-awareness.read-topology    true
The parameters are listed in the preceding table.
HBase Tuning
Tuning HBase
Configuring Component Parameters
The following parameters are configured in this test. Only some Yarn parameters are different between the x86 computing platform and Kunpeng 920 computing platform (the differences are described in the table). HBase and HDFS use the same set of parameters for the test.
| Component | Parameter | Recommended Value | Reason for Change |
|---|---|---|---|
| Yarn->NodeManager Yarn->ResourceManager | ResourceManager Java heap size | 1024 | Increase the JVM memory size to reduce the GC frequency. |
| Yarn->NodeManager Yarn->ResourceManager | NodeManager Java heap size | 1024 | |
| Yarn->NodeManager | yarn.nodemanager.resource.cpu-vcores | Same as the actual total number of physical cores of the DataNode | Number of CPU cores that can be allocated to a container. |
| Yarn->NodeManager | yarn.nodemanager.resource.memory-mb | Same as the actual physical memory capacity of the DataNode | Memory that can be allocated to a container. |
| Yarn->NodeManager | yarn.nodemanager.numa-awareness.enabled | true | NUMA awareness when NodeManager starts a container, which needs to be manually added. |
| Yarn->NodeManager | yarn.nodemanager.numa-awareness.read-topology | true | Automatic NUMA topology awareness of NodeManager, which needs to be manually added. |
| MapReduce2 | mapreduce.map.memory.mb | 7168 | Maximum memory that can be used by a map task. |
| MapReduce2 | mapreduce.reduce.memory.mb | 14336 | Maximum memory that can be used by a reduce task. |
| MapReduce2 | mapreduce.job.reduce.slowstart.completedmaps | 0.35 | Only if the map completion ratio reaches the value of this parameter, the system allocates resources to reduce. |
| HDFS->NameNode | NameNode Java heap size | 3072 | Increase the JVM memory size to reduce the GC frequency. |
| HDFS->NameNode | NameNode new generation size | 384 | |
| HDFS->NameNode | NameNode maximum new generation size | 384 | |
| HDFS->NameNode | dfs.namenode.service.handler.count | 128 | Number of threads used by the NameNode RPC server to monitor DataNode requests and other requests. You can increase the value as required. |
| HDFS->NameNode | dfs.namenode.handler.count | 1200 | Number of threads used by the NameNode RPC server to monitor client requests. You can increase the value as required. |
| HDFS->DataNode | dfs.datanode.handler.count | 512 | Number of DataNode service threads. You can increase the value as required. |
| HBase->RegionServer | HBase RegionServer Maximum Memory | 31744 | Increase the JVM memory size to reduce the GC frequency. |
| HBase->RegionServer | hbase.regionserver.handler.count | 150 | Number of RPC server instances on RegionServer. |
| HBase->RegionServer | hbase.regionserver.metahandler.count | 150 | Number of program instances that process high-priority requests in RegionServer. |
| HBase->RegionServer | hbase.regionserver.global.memstore.size | 0.4 | Percentage of the maximum JVM heap size (specified by Java -Xmx) allocated to MemStore. |
| HBase->RegionServer | hfile.block.cache.size | 0.4 | Percentage of RegionServer GC -Xmx occupied by the data cache. |
| HBase->RegionServer | hbase.hregion.memstore.flush.size | 267386880 | Size of RegionServer MemStore. Increasing the value can reduce the block. |
Enabling the NUMA Feature
Yarn 3.1.0 allows NUMA awareness to be enabled when the container is started. The principle is to read the CPU core and memory capacity of each NUMA node on the physical nodes. You can use the numactl command to specify the CPU range and membind range for starting the container and reduce cross-chip access.
- Install numactl.
yum install numactl.aarch64
- Enable NUMA awareness.
yarn.nodemanager.numa-awareness.enabled          true
yarn.nodemanager.numa-awareness.read-topology    true
The parameters are listed in the preceding table.