Using gala-gopher
As a data collection module, gala-gopher provides OS-level monitoring capabilities, supports dynamic probe installation and uninstallation, and integrates third-party probes in a non-intrusive manner to quickly expand the monitoring scope.
This chapter describes how to deploy and use the gala-gopher service.
Installation
Mount the repositories.
[oe-22.03-lts-sp3-everything] # openEuler 22.03-LTS-SP3 officially released repository
name=oe-2203-lts-sp3-everything
baseurl=http://repo.openeuler.org/openEuler-22.03-LTS-SP3/everything/x86_64/
enabled=1
gpgcheck=0
priority=1

[oe-22.03-lts-sp3-epol-update] # openEuler 22.03-LTS-SP3 Update officially released repository
name=oe-22.03-lts-sp3-epol-update
baseurl=http://repo.openeuler.org/openEuler-22.03-LTS-SP3/EPOL/update/main/x86_64/
enabled=1
gpgcheck=0
priority=1

[oe-22.03-lts-sp3-epol-main] # openEuler 22.03-LTS-SP3 EPOL officially released repository
name=oe-22.03-lts-sp3-epol-main
baseurl=http://repo.openeuler.org/openEuler-22.03-LTS-SP3/EPOL/main/x86_64/
enabled=1
gpgcheck=0
priority=1
Install gala-gopher.
# yum install gala-gopherConfiguration
Configuration Description
The configuration file of gala-gopher is /opt/gala-gopher/gala-gopher.conf. The configuration items in the file are described as follows (the parts that do not need to be manually configured are not described):
The following configurations can be modified as required:
global: Global configuration for gala-gopherlog_file_name: Log file name for gala-gopherlog_level: Log level for gala-gopher (currently unavailable)pin_path: Storage path for eBPF probe shared maps (default configuration recommended)
metric: Metrics output configurationout_channel: Output channels for metrics (web_server|kafka), leave blank to disablekafka_topic: Kafka topic configuration (when using kafka channel)
event: Event output configurationout_channel: Output channels for events (logs|kafka), leave blank to disablekafka_topic: Kafka topic configuration (when using kafka channel)
meta: Metadata output configurationout_channel: Output channels for metadata (logs|kafka), leave blank to disablekafka_topic: Kafka topic configuration (when using kafka channel)
imdb: Cache configuration specificationsmax_tables_num: Maximum number of cache tables (each meta file in /opt/gala-gopher/meta corresponds to one table)max_records_num: Maximum records per table (each probe typically generates at least one observation record per cycle)max_metrics_num: Maximum metrics per observation recordrecord_timeout: Record expiration time (records older than this will be deleted, in seconds)
web_server: Web server configurationport: Listening port
kafka: Kafka output configurationkafka_broker: Kafka server IP address and port
logs: Log output configurationmetric_dir: Directory for metrics logsevent_dir: Directory for event logsmeta_dir: Directory for metadata logsdebug_dir: Directory for runtime logs
probes: Native probe configurationname: Probe name (must match native probe name, such as "example" for example.probe)param: Startup parameters (see Startup Parameters)switch: Probe status (on/off)
extend_probes: Third-party probe configurationname: Probe namecommand: Startup commandparam: Startup parameters (see Startup Parameters)start_check: Condition check for auto mode (determines whether to start probe)switch: Probe status (on/off/auto; auto mode uses "start_check" result)
Startup Parameters
| Parameter | Description |
|---|---|
| -l | Enable/disable abnormal event reporting. |
| -t | Sampling interval (seconds), defaulting to 5s. |
| -T | Delay threshold (ms), defaulting to 0 ms. |
| -J | Jitter threshold (ms), defaulting to 0 ms. |
| -O | Offline threshold (ms), defaulting to 0 ms. |
| -D | Packet loss threshold, defaulting to 0 packets. |
| -F | task means to filter by task_whitelist.conf; [pid] means to monitor specific process only. |
| -P | Detection program scope for each probe (affects tcpprobe/taskprobe). |
| -U | Max resource utilization threshold, defaulting to 0%. |
| -L | Min resource utilization threshold, defaulting to 0%. |
| -c | Probe (tcp) client port identification, defaulting to disabled (0). |
| -N | Process observed by the probe (ksliprobe), defaulting to NULL. |
| -p | Target process binary path (such as -p /user/local/sbin/nginx), defaulting to NULL. |
| -w | Application filter path (such as -w /opt/gala-gopher/task_whitelist.conf), defaulting to NULL (no filter). |
| -n | NIC for tc ebpf (defaulting to all interfaces), such as -n eth0. |
Configuration File Example
Select the data output channels.
yamlmetric = { out_channel = "web_server"; kafka_topic = "gala_gopher"; }; event = { out_channel = "kafka"; kafka_topic = "gala_gopher_event"; }; meta = { out_channel = "kafka"; kafka_topic = "gala_gopher_metadata"; };Configure Kafka and Web Server.
yamlweb_server = { port = 8888; }; kafka = { kafka_broker = "<Kafka server IP address>:9092"; };Select the probe to be enabled. The following is an example.
yamlprobes = ( { name = "system_infos"; param = "-t 5 -w /opt/gala-gopher/task_whitelist.conf -l warn -U 80"; switch = "on"; }, ); extend_probes = ( { name = "tcp"; command = "/opt/gala-gopher/extend_probes/tcpprobe"; param = "-l warn -c 1 -P 7"; switch = "on"; } );
Start
After the configuration is complete, start gala-gopher.
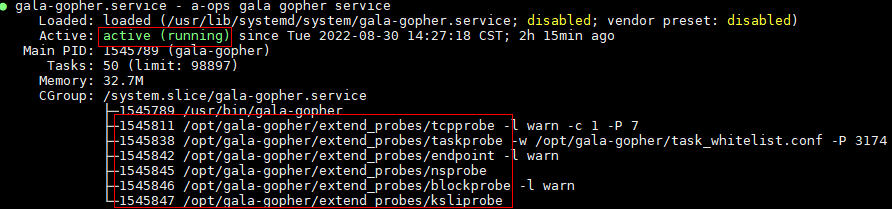
# systemctl start gala-gopher.serviceQuery the status of the gala-gopher service.
# systemctl status gala-gopher.serviceIf the following information is displayed, the service is started successfully: Check whether the enabled probe is started. If the probe thread does not exist, check the configuration file and gala-gopher run log file.
Note: The root permission is required for deploying and running gala-gopher.
How to Use
Deployment of External Dependent Software

As shown in the preceding figure, the green parts are external dependent components of gala-gopher. gala-gopher outputs metric data to Prometheus, metadata and abnormal events to Kafka. gala-anteater and gala-spider in gray rectangles obtain data from Prometheus and Kafka.
Note: Obtain the installation packages of Kafka and Prometheus from the official websites.
Output Data
Metric
Prometheus Server has a built-in Express Browser UI. You can use PromQL statements to query metric data. For details, see Using the expression browser in the official document. The following is an example.
If the specified metric is
gala_gopher_tcp_link_rcv_rtt, the metric data displayed on the UI is as follows:basicgala_gopher_tcp_link_rcv_rtt{client_ip="x.x.x.165",client_port="1234",hostname="openEuler",instance="x.x.x.172:8888",job="prometheus",machine_id="1fd3774xx",protocol="2",role="0",server_ip="x.x.x.172",server_port="3742",tgid="1516"} 1Metadata
You can directly consume data from the Kafka topic
gala_gopher_metadata. The following is an example.bash# Input request ./bin/kafka-console-consumer.sh --bootstrap-server x.x.x.165:9092 --topic gala_gopher_metadata # Output data {"timestamp": 1655888408000, "meta_name": "thread", "entity_name": "thread", "version": "1.0.0", "keys": ["machine_id", "pid"], "labels": ["hostname", "tgid", "comm", "major", "minor"], "metrics": ["fork_count", "task_io_wait_time_us", "task_io_count", "task_io_time_us", "task_hang_count"]}Abnormal events
You can directly consume data from the Kafka topic
gala_gopher_event. The following is an example.bash# Input request ./bin/kafka-console-consumer.sh --bootstrap-server x.x.x.165:9092 --topic gala_gopher_event # Output data {"timestamp": 1655888408000, "meta_name": "thread", "entity_name": "thread", "version": "1.0.0", "keys": ["machine_id", "pid"], "labels": ["hostname", "tgid", "comm", "major", "minor"], "metrics": ["fork_count", "task_io_wait_time_us", "task_io_count", "task_io_time_us", "task_hang_count"]}
Licensed under the MulanPSL2
 J.G.W.A.B. No. 11030102011597