Using gala-gopher
As a data collection module, gala-gopher provides OS-level monitoring capabilities, supports dynamic probe installation and uninstallation, and integrates third-party probes in a non-intrusive manner to quickly expand the monitoring scope.
This chapter describes how to deploy and use the gala-gopher service.
Installation
Mount the repositories.
[oe-2209]      # openEuler 23.09 officially released repository
name=oe2209
baseurl=http://119.3.219.20:82/openEuler:/23.09/standard_x86_64
enabled=1
gpgcheck=0
priority=1

[oe-2209:Epol] # openEuler 23.09: Epol officially released repository
name=oe2209_epol
baseurl=http://119.3.219.20:82/openEuler:/23.09:/Epol/standard_x86_64/
enabled=1
gpgcheck=0
priority=1
Install gala-gopher.
# yum install gala-gopherConfiguration
Configuration Description
The configuration file of gala-gopher is /opt/gala-gopher/gala-gopher.conf. The configuration items in the file are described as follows (the parts that do not need to be manually configured are not described):
The following configurations can be modified as required:
global: global configuration for gala-gopher.log_file_name: name of the gala-gopher log file.log_level: gala-gopher log level (currently not enabled).pin_path: path for storing the map shared by the eBPF probe (keep the default configuration).
metric: configuration for metric data output.out_channel: output channel for metrics (web_server,logs, orkafka). If empty, the output channel is disabled.kafka_topic: topic configuration for Kafka output.
event: configuration for abnormal event output.out_channel: output channel for events (logsorkafka). If empty, the output channel is disabled.kafka_topic: topic configuration for Kafka output.timeout: reporting interval for the same event.desc_language: language for event descriptions (zh_CNoren_US).
meta: configuration for metadata output.out_channel: output channel for metadata (logsorkafka). If empty, the output channel is disabled.kafka_topic: topic configuration for Kafka output.
ingress: probe data reporting configuration (currently unused).interval: unused.
egress: database reporting configuration (currently unused).interval: unused.time_range: unused.
imdb: cache configuration.max_tables_num: maximum number of cache tables. Each meta file in /opt/gala-gopher/meta corresponds to a table.max_records_num: maximum records per cache table. Each probe typically generates at least one record per observation period.max_metrics_num: maximum number of metrics per record.record_timeout: cache table aging time (seconds). Records not updated within this time are deleted.
web_server:web_serveroutput channel configuration.port: listening port.
rest_api_server:port: listening port for the REST API.ssl_auth: enables HTTPS encryption and authentication for the REST API (onoroff). Enable in production.private_key: absolute path to the server's private key file for HTTPS encryption (required ifssl_authison).cert_file: absolute path to the server's certificate file for HTTPS encryption (required ifssl_authison).ca_file: absolute path to the CA certificate for client authentication (required ifssl_authison).
kafka: Kafka output channel configuration.kafka_broker: IP address and port of the Kafka server.batch_num_messages: number of messages per batch.compression_codec: message compression type.queue_buffering_max_messages: maximum number of messages in the producer buffer.queue_buffering_max_kbytes: maximum size (KB) of the producer buffer.queue_buffering_max_ms: maximum time (ms) the producer waits for more messages before sending a batch.
logs:logsoutput channel configuration.metric_dir: path for metric data logs.event_dir: path for abnormal event logs.meta_dir: path for metadata logs.debug_dir: path for gala-gopher runtime logs.
Configuration File Example
Select the data output channels.
yamlmetric = { out_channel = "web_server"; kafka_topic = "gala_gopher"; }; event = { out_channel = "kafka"; kafka_topic = "gala_gopher_event"; }; meta = { out_channel = "kafka"; kafka_topic = "gala_gopher_metadata"; };Configure Kafka and Web Server.
yamlweb_server = { port = 8888; }; kafka = { kafka_broker = "<Kafka server IP address>:9092"; };Select the probe to be enabled. The following is an example.
yamlprobes = ( { name = "system_infos"; param = "-t 5 -w /opt/gala-gopher/task_whitelist.conf -l warn -U 80"; switch = "on"; }, ); extend_probes = ( { name = "tcp"; command = "/opt/gala-gopher/extend_probes/tcpprobe"; param = "-l warn -c 1 -P 7"; switch = "on"; } );
Start
After the configuration is complete, start gala-gopher.
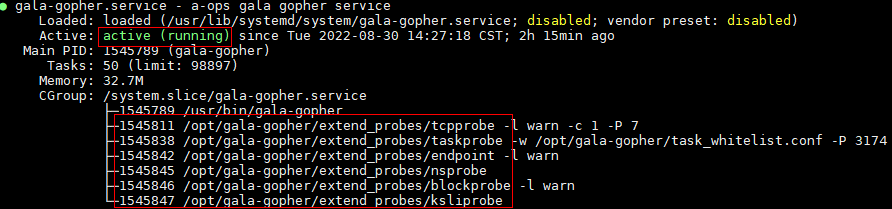
# systemctl start gala-gopher.serviceQuery the status of the gala-gopher service.
# systemctl status gala-gopher.serviceIf the following information is displayed, the service is started successfully: Check whether the enabled probe is started. If the probe thread does not exist, check the configuration file and gala-gopher run log file.
Note: The root permission is required for deploying and running gala-gopher.
How to Use
Deployment of External Dependent Software
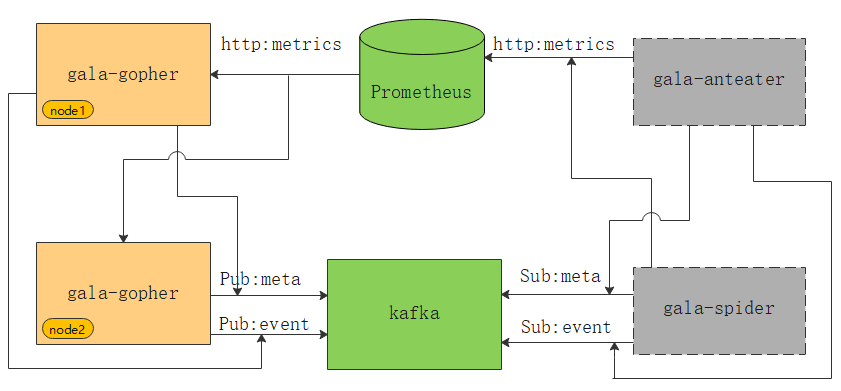
As shown in the preceding figure, the green parts are external dependent components of gala-gopher. gala-gopher outputs metric data to Prometheus, metadata and abnormal events to Kafka. gala-anteater and gala-spider in gray rectangles obtain data from Prometheus and Kafka.
Note: Obtain the installation packages of Kafka and Prometheus from the official websites.
REST Dynamic Configuration Interface
The web server port is configurable (default is 9999). The URL format is http://[gala-gopher-node-ip-address]:[port]/[function (collection feature)]. For example, the URL for the flamegraph is http://localhost:9999/flamegraph (the following documentation uses the flamegraph as an example).
Configuring the Probe Monitoring Scope
Probes are disabled by default and can be dynamically enabled and configured via the API. Taking the flamegraph as an example, the REST API can be used to enable oncpu, offcpu, and mem flamegraph capabilities. The monitoring scope can be configured based on four dimensions: process ID, process name, container ID, and pod.
Below is an example of an API that simultaneously enables the oncpu and offcpu collection features for the flamegraph:
curl -X PUT http://localhost:9999/flamegraph --data-urlencode json='
{
    "cmd": {
        "bin": "/opt/gala-gopher/extend_probes/stackprobe",
        "check_cmd": "",
        "probe": [
            "oncpu",
            "offcpu"
        ]
    },
    "snoopers": {
        "proc_id": [
            101,
            102
        ],
        "proc_name": [
            {
                "comm": "app1",
                "cmdline": "",
                "debugging_dir": ""
            },
            {
                "comm": "app2",
                "cmdline": "",
                "debugging_dir": ""
            }
        ],
        "pod_id": [
            "pod1",
            "pod2"
        ],
        "container_id": [
            "container1",
            "container2"
        ]
    }
}'
A full description of the collection features is provided below:
| Collection Feature | Description | Sub-item Scope | Monitoring Targets | Startup File | Startup Condition |
|---|---|---|---|---|---|
| flamegraph | Online performance flamegraph observation | oncpu, offcpu, mem | proc_id, proc_name, pod_id, container_id | $gala-gopher-dir/stackprobe | NA |
| l7 | Application layer 7 protocol observation | l7_bytes_metrics, l7_rpc_metrics, l7_rpc_trace | proc_id, proc_name, pod_id, container_id | $gala-gopher-dir/l7probe | NA |
| tcp | TCP exception and state observation | tcp_abnormal, tcp_rtt, tcp_windows, tcp_rate, tcp_srtt, tcp_sockbuf, tcp_stats, tcp_delay | proc_id, proc_name, pod_id, container_id | $gala-gopher-dir/tcpprobe | NA |
| socket | Socket (TCP/UDP) exception observation | tcp_socket, udp_socket | proc_id, proc_name, pod_id, container_id | $gala-gopher-dir/endpoint | NA |
| io | Block layer I/O observation | io_trace, io_err, io_count, page_cache | NA | $gala-gopher-dir/ioprobe | NA |
| proc | Process system calls, I/O, DNS, VFS observation | base_metrics, proc_syscall, proc_fs, proc_io, proc_dns, proc_pagecache | proc_id, proc_name, pod_id, container_id | $gala-gopher-dir/taskprobe | NA |
| jvm | JVM layer GC, threads, memory, cache observation | NA | proc_id, proc_name, pod_id, container_id | $gala-gopher-dir/jvmprobe | NA |
| ksli | Redis performance SLI (access latency) observation | NA | proc_id, proc_name, pod_id, container_id | $gala-gopher-dir/ksliprobe | NA |
| postgre_sli | PG DB performance SLI (access latency) observation | NA | proc_id, proc_name, pod_id, container_id | $gala-gopher-dir/pgsliprobe | NA |
| opengauss_sli | openGauss access throughput observation | NA | [ip, port, dbname, user, password] | $gala-gopher-dir/pg_stat_probe.py | NA |
| dnsmasq | DNS session observation | NA | proc_id, proc_name, pod_id, container_id | $gala-gopher-dir/rabbitmq_probe.sh | NA |
| lvs | LVS session observation | NA | NA | $gala-gopher-dir/trace_lvs | lsmod|grep ip_vs| wc -l |
| nginx | Nginx L4/L7 layer session observation | NA | proc_id, proc_name, pod_id, container_id | $gala-gopher-dir/nginx_probe | NA |
| haproxy | Haproxy L4/7 layer session observation | NA | proc_id, proc_name, pod_id, container_id | $gala-gopher-dir/trace_haproxy | NA |
| kafka | Kafka producer/consumer topic observation | NA | dev, port | $gala-gopher-dir/kafkaprobe | NA |
| baseinfo | System basic information | cpu, mem, nic, disk, net, fs, proc, host | proc_id, proc_name, pod_id, container_id | system_infos | NA |
| virt | Virtualization management information | NA | NA | virtualized_infos | NA |
| tprofiling | Thread-level performance profiling observation | oncpu, syscall_file, syscall_net, syscall_lock, syscall_sched | proc_id, proc_name |
Configuring Probe Runtime Parameters
Probes require additional parameter settings during runtime, such as configuring the sampling period and reporting period for flamegraphs.
curl -X PUT http://localhost:9999/flamegraph --data-urlencode json='
{
    "params": {
        "report_period": 180,
        "sample_period": 180,
        "metrics_type": [
            "raw",
            "telemetry"
        ]
    }
}'
Detailed runtime parameters are as follows:
| Parameter | Description | Default & Range | Unit | Supported Monitoring Scope | Supported by gala-gopher |
|---|---|---|---|---|---|
| sample_period | Sampling period | 5000, [100~10000] | ms | io, tcp | Y |
| report_period | Reporting period | 60, [5~600] | s | ALL | Y |
| latency_thr | Latency reporting threshold | 0, [10~100000] | ms | tcp, io, proc, ksli | Y |
| offline_thr | Process offline reporting threshold | 0, [10~100000] | ms | proc | Y |
| drops_thr | Packet loss reporting threshold | 0, [10~100000] | package | tcp, nic | Y |
| res_lower_thr | Resource percentage lower limit | 0%, [0%~100%] | percent | ALL | Y |
| res_upper_thr | Resource percentage upper limit | 0%, [0%~100%] | percent | ALL | Y |
| report_event | Report abnormal events | 0, [0, 1] | NA | ALL | Y |
| metrics_type | Report telemetry metrics | raw, [raw, telemetry] | NA | ALL | N |
| env | Working environment type | node, [node, container, kubenet] | NA | ALL | N |
| report_source_port | Report source port | 0, [0, 1] | NA | tcp | Y |
| l7_protocol | Layer 7 protocol scope | http, [http, pgsql, mysql, redis, kafka, mongo, rocketmq, dns] | NA | l7 | Y |
| support_ssl | Support SSL encrypted protocol observation | 0, [0, 1] | NA | l7 | Y |
| multi_instance | Output separate flamegraphs for each process | 0, [0, 1] | NA | flamegraph | Y |
| native_stack | Display native language stack (for JAVA processes) | 0, [0, 1] | NA | flamegraph | Y |
| cluster_ip_backend | Perform Cluster IP backend conversion | 0, [0, 1] | NA | tcp, l7 | Y |
| pyroscope_server | Set flamegraph UI server address | localhost:4040 | NA | flamegraph | Y |
| svg_period | Flamegraph SVG file generation period | 180, [30, 600] | s | flamegraph | Y |
| perf_sample_period | Period for collecting stack info in oncpu flamegraph | 10, [10, 1000] | ms | flamegraph | Y |
| svg_dir | Directory for storing flamegraph SVG files | "/var/log/gala-gopher/stacktrace" | NA | flamegraph | Y |
| flame_dir | Directory for storing raw stack info in flamegraphs | "/var/log/gala-gopher/flamegraph" | NA | flamegraph | Y |
| dev_name | Observed network card/disk device name | "" | NA | io, kafka, ksli, postgre_sli, baseinfo, tcp | Y |
| continuous_sampling | Enable continuous sampling | 0, [0, 1] | NA | ksli | Y |
| elf_path | Path to the executable file to observe | "" | NA | nginx, haproxy, dnsmasq | Y |
| kafka_port | Kafka port number to observe | 9092, [1, 65535] | NA | kafka | Y |
| cadvisor_port | Port number for starting cadvisor | 8080, [1, 65535] | NA | cadvisor | Y |
Starting and Stopping Probes
curl -X PUT http://localhost:9999/flamegraph --data-urlencode json='
{
    "state": "running" // optional: running, stopped
}'
Constraints and Limitations
- The interface is stateless. The settings uploaded each time represent the final runtime configuration for the probe, including state, parameters, and monitoring scope.
- Monitoring targets can be combined arbitrarily, and the monitoring scope is the union of all specified targets.
- The startup file must be valid and accessible.
- Collection features can be enabled partially or fully as needed, but disabling a feature requires disabling it entirely.
- The monitoring target for opengauss is a DB instance (IP/Port/dbname/user/password).
- The interface can receive a maximum of 2048 characters per request.
Querying Probe Configurations and Status
curl -X GET http://localhost:9999/flamegraph
{
    "cmd": {
        "bin": "/opt/gala-gopher/extend_probes/stackprobe",
        "check_cmd": ""
        "probe": [
            "oncpu",
            "offcpu"
        ]
    },
    "snoopers": {
        "proc_id": [
            101,
            102
        ],
        "proc_name": [
            {
                "comm": "app1",
                "cmdline": "",
                "debugging_dir": ""
            },
            {
                "comm": "app2",
                "cmdline": "",
                "debugging_dir": ""
            }
        ],
        "pod_id": [
            "pod1",
            "pod2"
        ],
        "container_id": [
            "container1",
            "container2"
        ]
    },
    "params": {
        "report_period": 180,
        "sample_period": 180,
        "metrics_type": [
            "raw",
            "telemetry"
        ]
    },
    "state": "running"
}
Introduction to stackprobe
A performance flamegraph tool designed for cloud-native environments.
Features
- Supports observation of applications written in C/C++, Go, Rust, and Java.
- Call stack supports container and process granularity: For processes within containers, the workload Pod name and container name are marked with
[Pod]and[Con]prefixes at the bottom of the call stack. Process names are prefixed with[<pid>], while threads and functions (methods) have no prefix. - Supports generating SVG format flamegraphs locally or uploading call stack data to middleware.
- Supports generating/uploading flamegraphs for multiple instances based on process granularity.
- For Java processes, flamegraphs can simultaneously display native methods and Java methods.
- Supports multiple types of flamegraphs, including oncpu, offcpu, and mem.
- Supports custom sampling periods.
Usage Instructions
Basic startup command example: Start the performance flamegraph with default parameters.
curl -X PUT http://localhost:9999/flamegraph -d json='{ "cmd": {"probe": ["oncpu"] }, "snoopers": {"proc_name": [{ "comm": "cadvisor"}] }, "state": "running"}'Advanced startup command example: Start the performance flamegraph with custom parameters. For a complete list of configurable parameters, refer to Configuring Probe Runtime Parameters.
curl -X PUT http://localhost:9999/flamegraph -d json='{ "cmd": { "check_cmd": "", "probe": ["oncpu", "offcpu", "mem"] }, "snoopers": { "proc_name": [{ "comm": "cadvisor", "cmdline": "", "debugging_dir": "" }, { "comm": "java", "cmdline": "", "debugging_dir": "" }] }, "params": { "perf_sample_period": 100, "svg_period": 300, "svg_dir": "/var/log/gala-gopher/stacktrace", "flame_dir": "/var/log/gala-gopher/flamegraph", "pyroscope_server": "localhost:4040", "multi_instance": 1, "native_stack": 0 }, "state": "running"}'Key configuration options explained:
Enabling flamegraph types:
Set via the
probeparameter. Values includeoncpu,offcpu, andmem, representing CPU usage time, blocked time, and memory allocation statistics, respectively.Example:
"probe": ["oncpu", "offcpu", "mem"]Setting the period for generating local SVG flamegraphs:
Configured via the
svg_periodparameter, in seconds. Default is 180, with an optional range of [30, 600].Example:
"svg_period": 300Enabling/disabling stack information upload to Pyroscope:
Set via the
pyroscope_serverparameter. The value must include the address and port. If empty or incorrectly formatted, the probe will not attempt to upload stack information. The upload period is 30 seconds.Example:
"pyroscope_server": "localhost:4040"Setting the call stack sampling period:
Configured via the
perf_sample_periodparameter, in milliseconds. Default is 10, with an optional range of [10, 1000]. This parameter only applies to oncpu flamegraphs.Example:
"perf_sample_period": 100Enabling/disabling multi-instance flamegraph generation:
Set via the
multi_instanceparameter, with values 0 or 1. Default is 0. A value of 0 merges flamegraphs for all processes, while 1 generates separate flamegraphs for each process.Example:
"multi_instance": 1Enabling/disabling native call stack collection:
Set via the
native_stackparameter, with values 0 or 1. Default is 0. This parameter only applies to Java processes. A value of 0 disables collection of the JVM's native call stack, while 1 enables it.Example:
"native_stack": 1Visualization: (Left:
"native_stack": 1, Right:"native_stack": 0)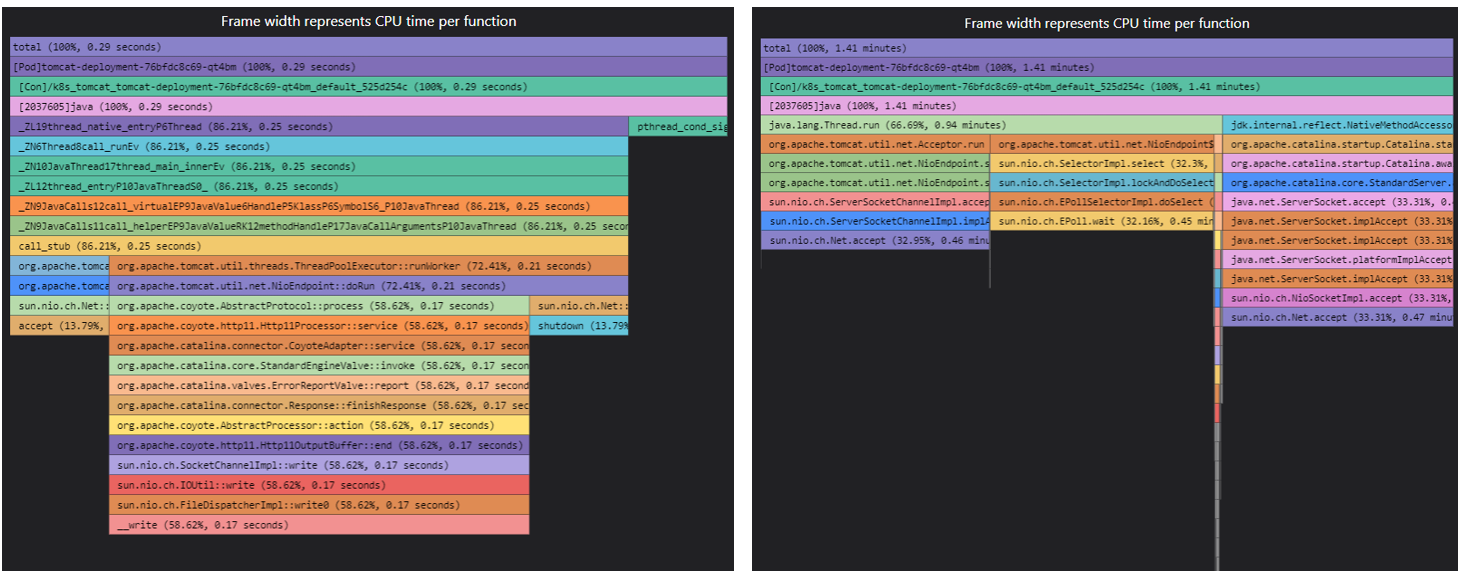
Implementation Plan
1. User-Space Program Logic
The program periodically (every 30 seconds) converts kernel-reported stack information from addresses to symbols using the symbol table. It then uses the flamegraph plugin or pyroscope to generate a flame graph from the symbolized call stack.
The approach to obtaining the symbol table differs based on the code segment type.
Kernel Symbol Table: Access /proc/kallsyms.
Native Language Symbol Table: Query the process virtual memory mapping file (/proc/{pid}/maps) to retrieve address mappings for each code segment in the process memory. The libelf library is then used to load the symbol table of the corresponding module for each segment.
Java Language Symbol Table:
Since Java methods are not statically mapped to the process virtual address space, alternative methods are used to obtain the symbolized Java call stack.
Method 1: Perf Observation
A JVM agent dynamic library is loaded into the Java process to monitor JVM method compilation and loading events. This allows real-time recording of memory address-to-Java symbol mappings, generating the Java process symbol table. This method requires the Java process to be launched with the -XX:+PreserveFramePointer option. Its key advantage is that the flame graph can display the JVM call stack, and the resulting Java flame graph can be merged with those of other processes for unified visualization.
Method 2: JFR Observation
The JVM built-in profiler, Java Flight Recorder (JFR), is dynamically enabled to monitor various events and metrics of the Java application. This is accomplished by loading a Java agent into the Java process, which internally calls the JFR API. This method offers the advantage of more precise and comprehensive collection of Java method call stacks.
Both Java performance analysis methods can be loaded in real time (without restarting the Java process) and feature low overhead. When stackprobe startup parameters are configured as "multi_instance": 1 and "native_stack": 0, it uses Method 2 to generate the Java process flame graph; otherwise, it defaults to Method 1.
2. Kernel-Space Program Logic
The kernel-space functionality is implemented using eBPF. Different flame graph types correspond to distinct eBPF programs. These programs periodically or through event triggers traverse the current user-space and kernel-space call stacks, reporting the results to user space.
2.1 On-CPU Flame Graph
A sampling eBPF program is attached to perf software event PERF_COUNT_SW_CPU_CLOCK to periodically sample the call stack.
2.2 Off-CPU Flame Graph
A sampling eBPF program is attached to process scheduling tracepoint sched_switch. This program records the time and process ID when a process is scheduled out and samples the call stack when the process is scheduled back in.
2.3 Memory Flame Graph
A sampling eBPF program is attached to page fault tracepoint page_fault_user. The call stack is sampled whenever this event is triggered.
3. Java Language Support
stackprobe main process:
- Receives an IPC message to identify the Java process to be observed.
- Utilizes the Java agent loading module to inject the JVM agent program into the target Java process:
jvm_agent.so(for Method 1) orJstackProbeAgent.jar(for Method 2). - For Method 1, the main process loads the
java-symbols.binfile of the corresponding Java process to facilitate address-to-symbol conversion. For Method 2, it loads thestacks-{flame_type}.txtfile of the corresponding Java process, which can be directly used to generate flame graphs.
Java agent loading module:
- Detects a new Java process and copies the JVM agent program to
/proc/<pid>/root/tmpin the process space (to ensure visibility to the JVM inside the container during attachment). - Adjusts the ownership of the directory and JVM agent program to match the observed Java process.
- Launches the
jvm_attachsubprocess and passes the relevant parameters of the observed Java process.
- Detects a new Java process and copies the JVM agent program to
JVM agent program:
jvm_agent.so: Registers JVMTI callback functions.
When the JVM loads a Java method or dynamically compiles a native method, it triggers the callback function. The callback records the Java class name, method name, and corresponding memory address in
/proc/<pid>/root/tmp/java-data-<pid>/java-symbols.binwithin the observed Java process space.JstackProbeAgent.jar: Invokes the JFR API.
Activates JFR for 30 seconds and transforms the JFR statistics into a stack format suitable for flame graphs. The output is saved to
/proc/<pid>/root/tmp/java-data-<pid>/stacks-<flame_type>.txtin the observed Java process space. For more information, refer to JstackProbe Introduction.
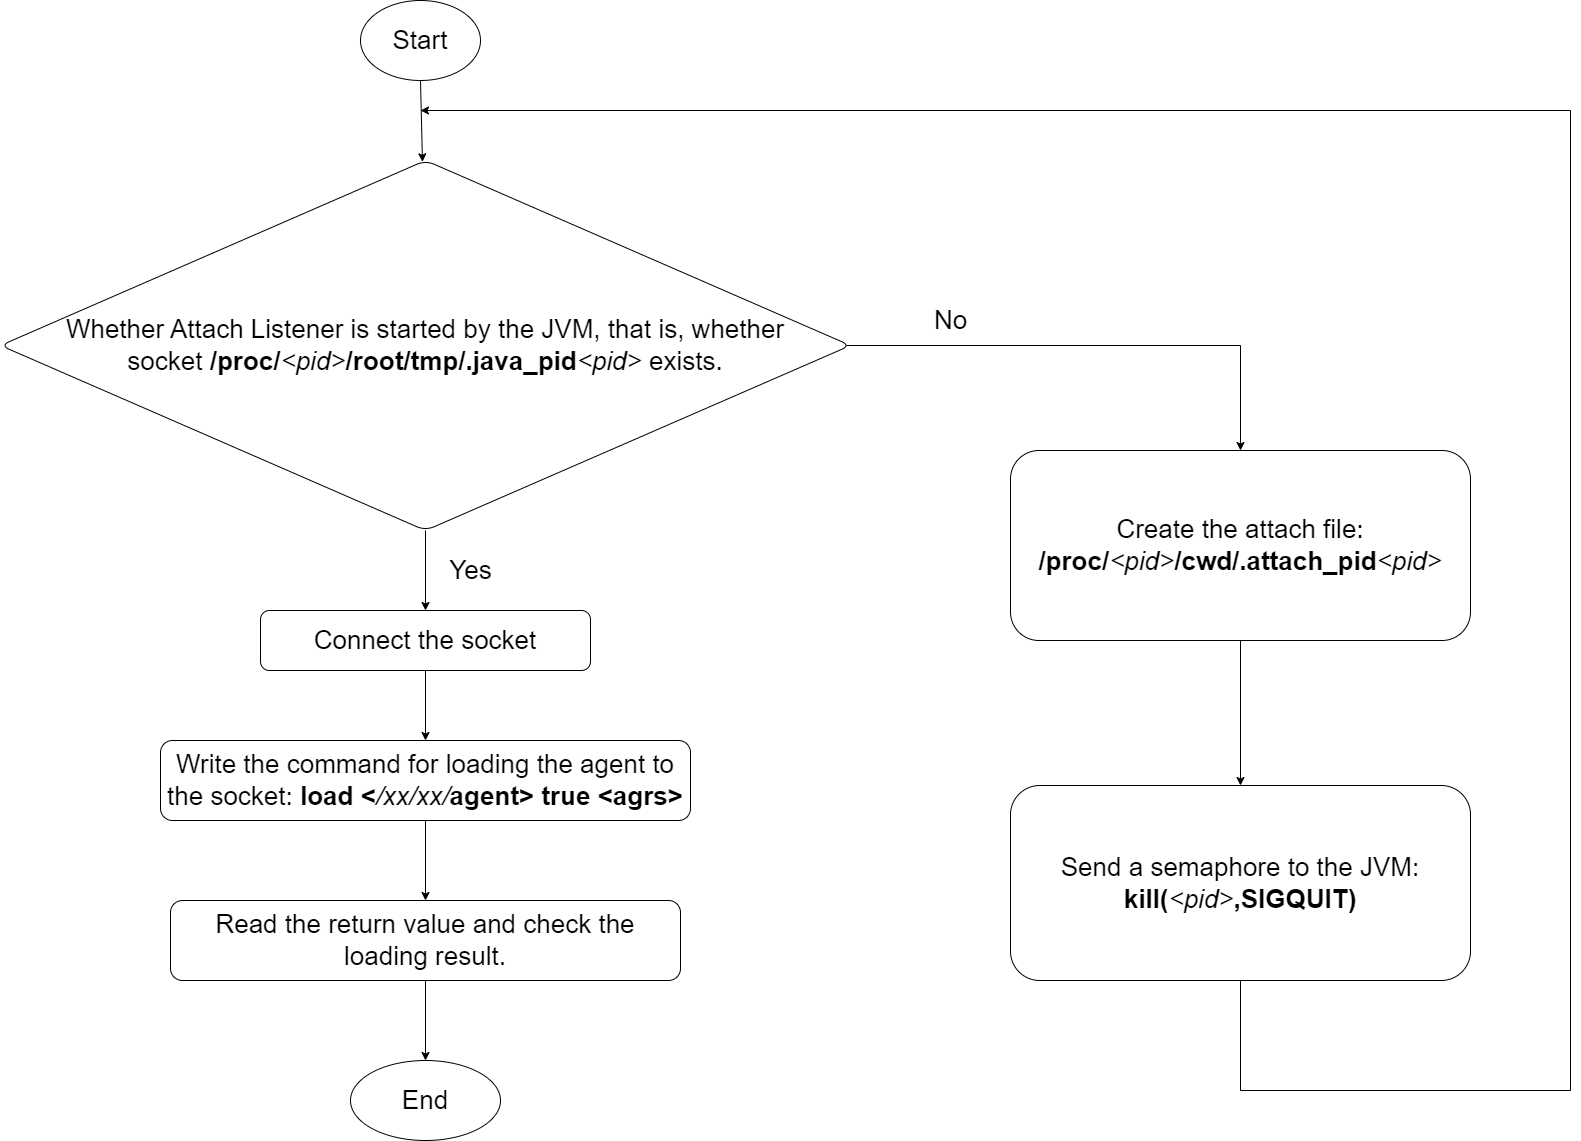
jvm_attach: Dynamically loads the JVM agent program into the JVM of the observed process (based on
sun.tools.attach.LinuxVirtualMachinefrom the JDK source code and thejattachtool).- Configures its own namespace (the JVM requires the attaching process and the observed process to share the same namespace for agent loading).
- Verifies if the JVM attach listener is active (by checking for the existence of the UNIX socket file
/proc/<pid>/root/tmp/.java_pid<pid>). - If inactive, creates
/proc/<pid>/cwd/.attach_pid<pid>and sends a SIGQUIT signal to the JVM. - Establishes a connection to the UNIX socket.
- Interprets the response; a value of 0 indicates successful attachment.
Attachment process diagram:
Precautions
- To achieve the best observation results for Java applications, configure the stackprobe startup options to
"multi_instance": 1and"native_stack": 0to enable JFR observation (JDK8u262+). Otherwise, stackprobe will use perf to generate Java flame graphs. When using perf, ensure that the JVM optionXX:+PreserveFramePointeris enabled (JDK8 or later).
Constraints
- Supports observation of Java applications based on the hotSpot JVM.
Introduction to tprofiling
tprofiling, a thread-level application performance diagnostic tool provided by gala-gopher, leverages eBPF technology. It monitors key system performance events at the thread level, associating them with detailed event content. This enables real-time recording of thread states and key activities, helping users quickly pinpoint application performance bottlenecks.
Features
From the OS perspective, a running application comprises multiple processes, each containing multiple running threads. tprofiling monitors and records key activities (referred to as events) performed by these threads. The tool then presents these events on a timeline in the front-end interface, providing an intuitive view of what each thread is doing at any given moment—whether it is executing on the CPU or blocked by file or network I/O operations. When performance issues arise, analyzing the sequence of key performance events for a given thread enables rapid problem isolation and localization.
Currently, with its implemented event monitoring capabilities, tprofiling can identify application performance issues such as:
- File I/O latency and blocking
- Network I/O latency and blocking
- Lock contention
- Deadlocks
As more event types are added and refined, tprofiling will cover a broader range of application performance problems.
Event Observation Scope
tprofiling currently supports two main categories of system performance events: syscall events and on-CPU events.
Syscall Events
Application performance often suffers from system resource bottlenecks like excessive CPU usage or I/O wait times. Applications typically access these resources through syscalls. Observation key syscall events helps identify time-consuming or blocking resource access operations.
The syscall events currently observed by tprofiling are detailed in the Supported Syscall Events section. These events fall into categories such as file operations, network operations, lock operations, and scheduling operations. Examples of observed syscall events include:
- File Operations
read/write: Reading from or writing to disk files or network connections; these operations can be time-consuming or blocking.sync/fsync: Synchronizing file data to disk, which blocks the thread until completion.
- Network Operations
send/recv: Reading from or writing to network connections; these operations can be time-consuming or blocking.
- Lock Operations
futex: A syscall related to user-mode lock implementations. Afutexcall often indicates lock contention, potentially causing threads to block.
- Scheduling Operations: These syscall events can change a thread's state, such as yielding the CPU, sleeping, or waiting for other threads.
nanosleep: The thread enters a sleep state.epoll_wait: The thread waits for I/O events, blocking until an event arrives.
on-CPU Events
A thread's running state can be categorized as either on-CPU (executing on a CPU core) or off-CPU (not executing). Observation on-CPU events helps identify threads performing time-consuming CPU-bound operations.
Event Content
Thread profiling events include the following information:
Event Source: This includes the thread ID, thread name, process ID, process name, container ID, container name, host ID, and host name associated with the event.
thread.pid: The thread ID.thread.comm: The thread name.thread.tgid: The process ID.proc.name: The process name.container.id: The container ID.container.name: The container name.host.id: The host ID.host.name: The host name.
Event Attributes: These include common attributes and extended attributes.
Common Attributes: These include the event name, event type, start time, end time, and duration.
event.name: The event name.event.type: The event type, which can beoncpu,file,net,lock, orsched.start_time: The event start time, which is the start time of the first event in an aggregated event. See Aggregated Events for more information.end_time: The event end time, which is the end time of the last event in an aggregated event.duration: The event duration, calculated as (end_time-start_time).count: The number of aggregated events.
Extended Attributes: These provide more detailed information specific to each syscall event. For example,
readandwriteevents for files or network connections include the file path, network connection details, and function call stack.func.stack: The function call stack.file.path: The file path for file-related events.sock.conn: The TCP connection information for network-related events.futex.op: Thefutexoperation type, which can bewaitorwake.
Refer to the Supported Syscall Events section for details on the extended attributes supported by each event type.
Event Output
As an eBPF probe extension provided by gala-gopher, tprofiling sends generated system events to gala-gopher for processing. gala-gopher then outputs these events in the openTelemetry format and publishes them as JSON messages to a Kafka queue. Front-end applications can consume these tprofiling events by subscribing to the Kafka topic.
Here's an example of a thread profiling event output:
{
    "Timestamp": 1661088145000,
    "SeverityText": "INFO",
    "SeverityNumber": 9,
    "Body": "",
    "Resource": {
        "host.id": "",
        "host.name": "",
        "thread.pid": 10,
        "thread.tgid": 10,
        "thread.comm": "java",
        "proc.name": "xxx.jar",
        "container.id": "",
        "container.name": "",
    },
    "Attributes": {
        values: [
            {
                // common info
                "event.name": "read",
                "event.type": "file",
                "start_time": 1661088145000,
                "end_time": 1661088146000,
                "duration": 0.1,
                "count": 1,
                // extend info
                "func.stack": "read;",
                "file.path": "/test.txt"
            },
            {
                "event.name": "oncpu",
                "event.type": "oncpu",
                "start_time": 1661088146000,
                "end_time": 1661088147000,
                "duration": 0.1,
                "count": 1,
            }
        ]
    }
}
Key fields:
Timestamp: The timestamp when the event was reported.Resource: Information about the event source.Attributes: Event attribute information, containing avalueslist. Each item in the list represents a tprofiling event from the same source and includes the event's attributes.
Quick Start
Installation
tprofiling is an eBPF probe extension for gala-gopher, so you must first install gala-gopher before enabling tprofiling.
gala-ops provides a demo UI for tprofiling based on Kafka, Logstash, Elasticsearch, and Grafana. You can use the gala-ops deployment tools for quick setup.
Architecture
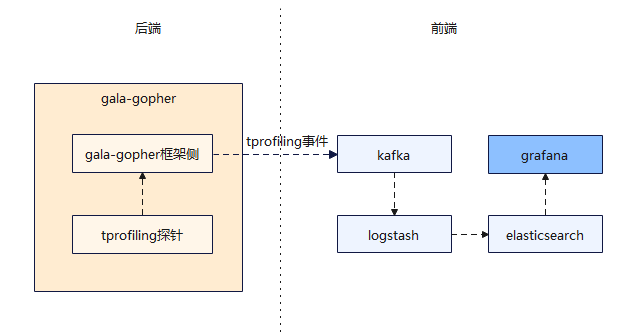
Software components:
- Kafka: An open-source message queue that receives and stores tprofiling events collected by gala-gopher.
- Logstash: A real-time, open-source log collection engine that consumes tprofiling events from Kafka, processes them (filtering, transformation, etc.), and sends them to Elasticsearch.
- Elasticsearch: An open, distributed search and analytics engine that stores the processed tprofiling events for querying and visualization in Grafana.
- Grafana: An open-source visualization tool to query and visualize the collected tprofiling events. Users interact with tprofiling through the Grafana UI to analyze application performance.
Deploying the tprofiling Probe
First, install gala-gopher as described in the gala-gopher documentation. Because tprofiling events are sent to Kafka, configure the Kafka service address during deployment.
After installing and running gala-gopher, start the tprofiling probe using gala-gopher's HTTP-based dynamic configuration API:
curl -X PUT http://<gopher-node-ip>:9999/tprofiling -d json='{"cmd": {"probe": ["oncpu", "syscall_file", "syscall_net", "syscall_sched", "syscall_lock"]}, "snoopers": {"proc_name": [{"comm": "java"}]}, "state": "running"}'Configuration parameters:
<gopher-node-ip>: The IP address of the node where gala-gopher is deployed.probe: Undercmd, theprobeconfiguration specifies the system events that the tprofiling probe monitors.oncpu,syscall_file,syscall_net,syscall_sched, andsyscall_lockcorrespond to on-CPU events and file, network, scheduling, and lock syscall events, respectively. You can enable only the desired tprofiling event types.proc_name: Undersnoopers, theproc_nameconfiguration filters the processes to monitor by process name. You can also filter by process ID using theproc_idconfiguration. See REST Dynamic Configuration Interface for details.
To stop the tprofiling probe, run:
curl -X PUT http://<gopher-node-ip>:9999/tprofiling -d json='{"state": "stopped"}'Deploying the Front-End Software
The tprofiling UI requires Kafka, Logstash, Elasticsearch, and Grafana. Install these components on a management node. You can use the gala-ops deployment tools for quick installation; see the Online Deployment Documentation.
On the management node, obtain the deployment script from the Online Deployment Documentation and run the following command to install Kafka, Logstash, and Elasticsearch with one command:
sh deploy.sh middleware -K <deployment_node_management_IP_address> -E <deployment_node_management_IP_address> -A -pRun the following command to install Grafana:
sh deploy.sh grafana -P <Prometheus_server_address)> -E <Elasticsearch_server_address>Usage
After completing the deployment, access A-Ops by browsing to http://[deployment_node_management_IP_address]:3000 and logging into Grafana. The default username and password are both admin.
After logging in, find the ThreadProfiling dashboard.
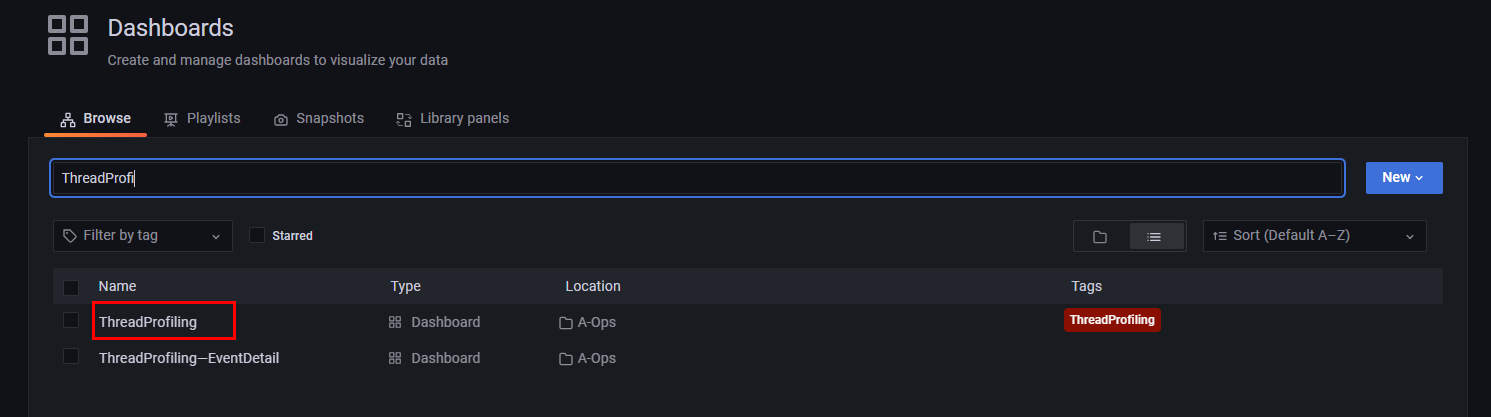
Click to enter the tprofiling UI and explore its features.
Use Cases
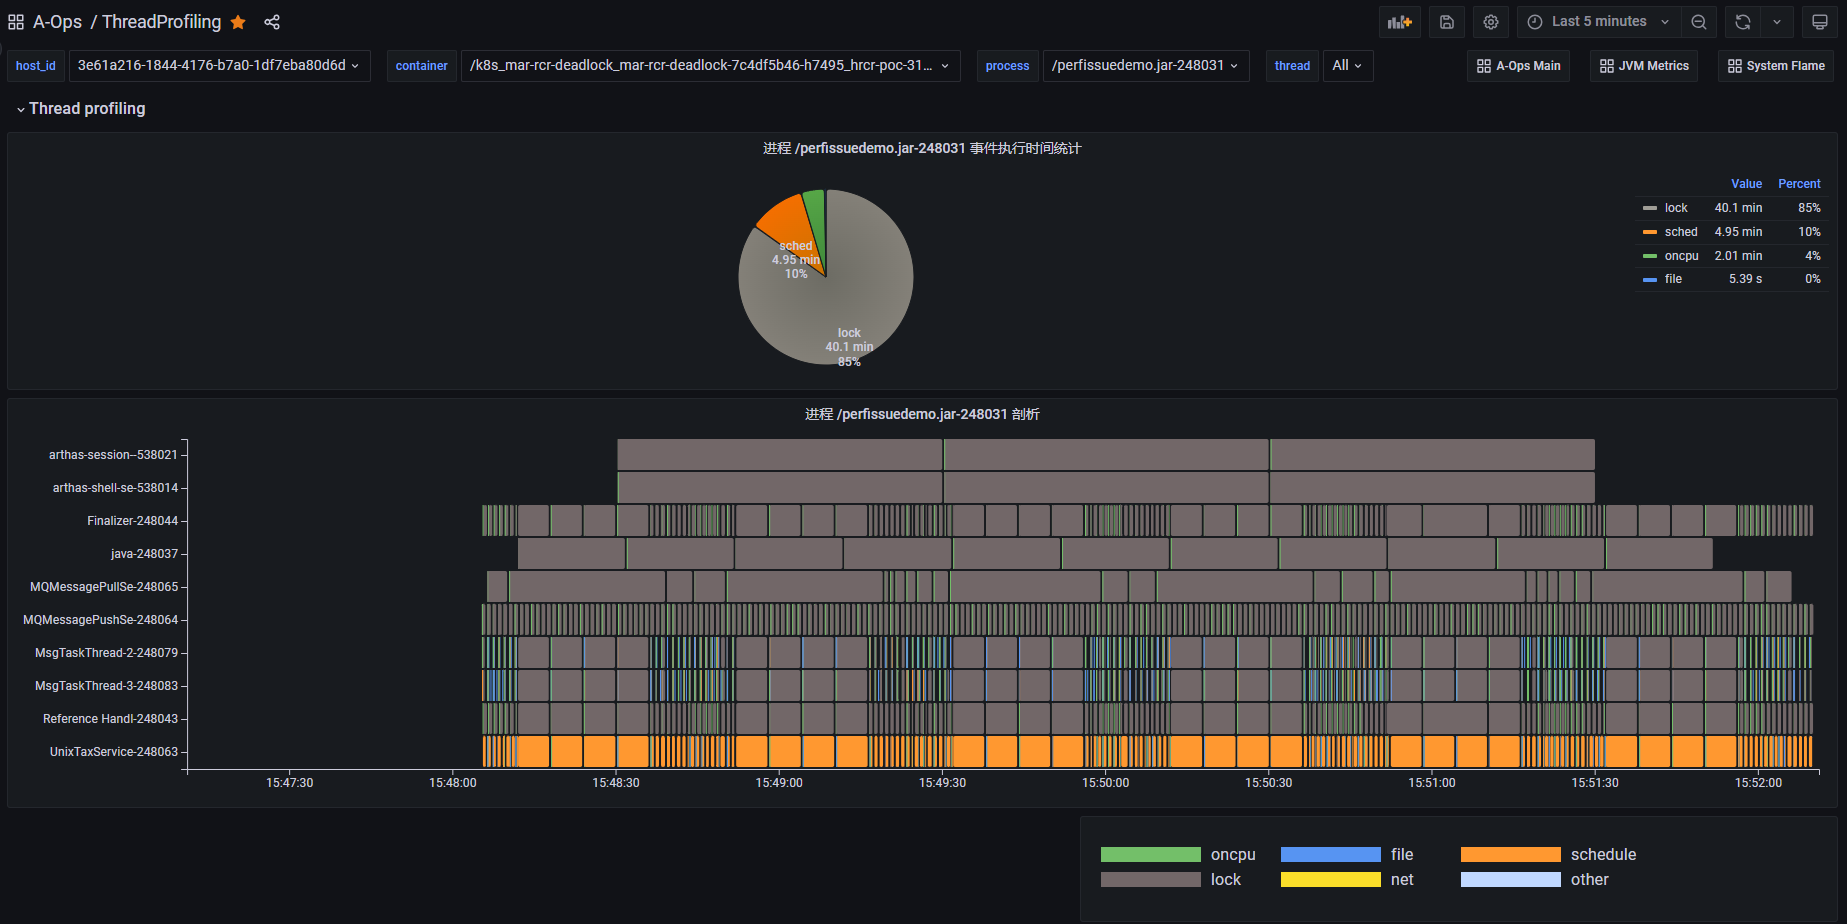
Case 1: Deadlock Detection
The above diagram shows the thread profiling results of a deadlock demo process. The pie chart shows that lock events (in gray) consume a significant portion of the execution time. The lower section displays the thread profiling results for the entire process, with the vertical axis representing the sequence of profiling events for different threads. The java main thread remains blocked. The LockThd1 and LockThd2 service threads execute oncpu and file events, followed by simultaneous, long-duration lock events. Hovering over a lock event reveals that it triggers a futex syscall lasting 60 seconds.
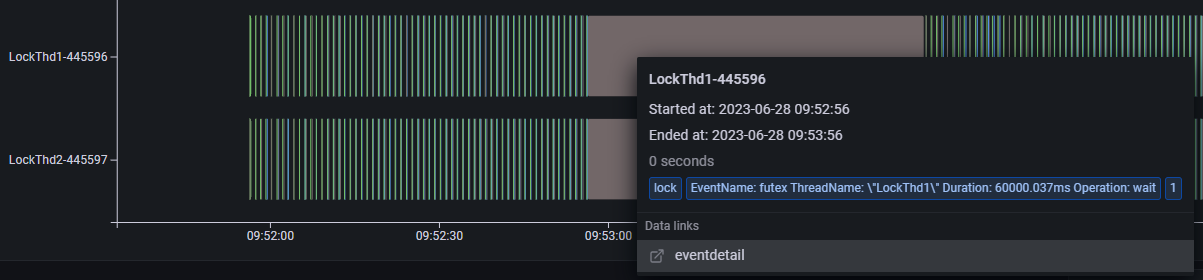
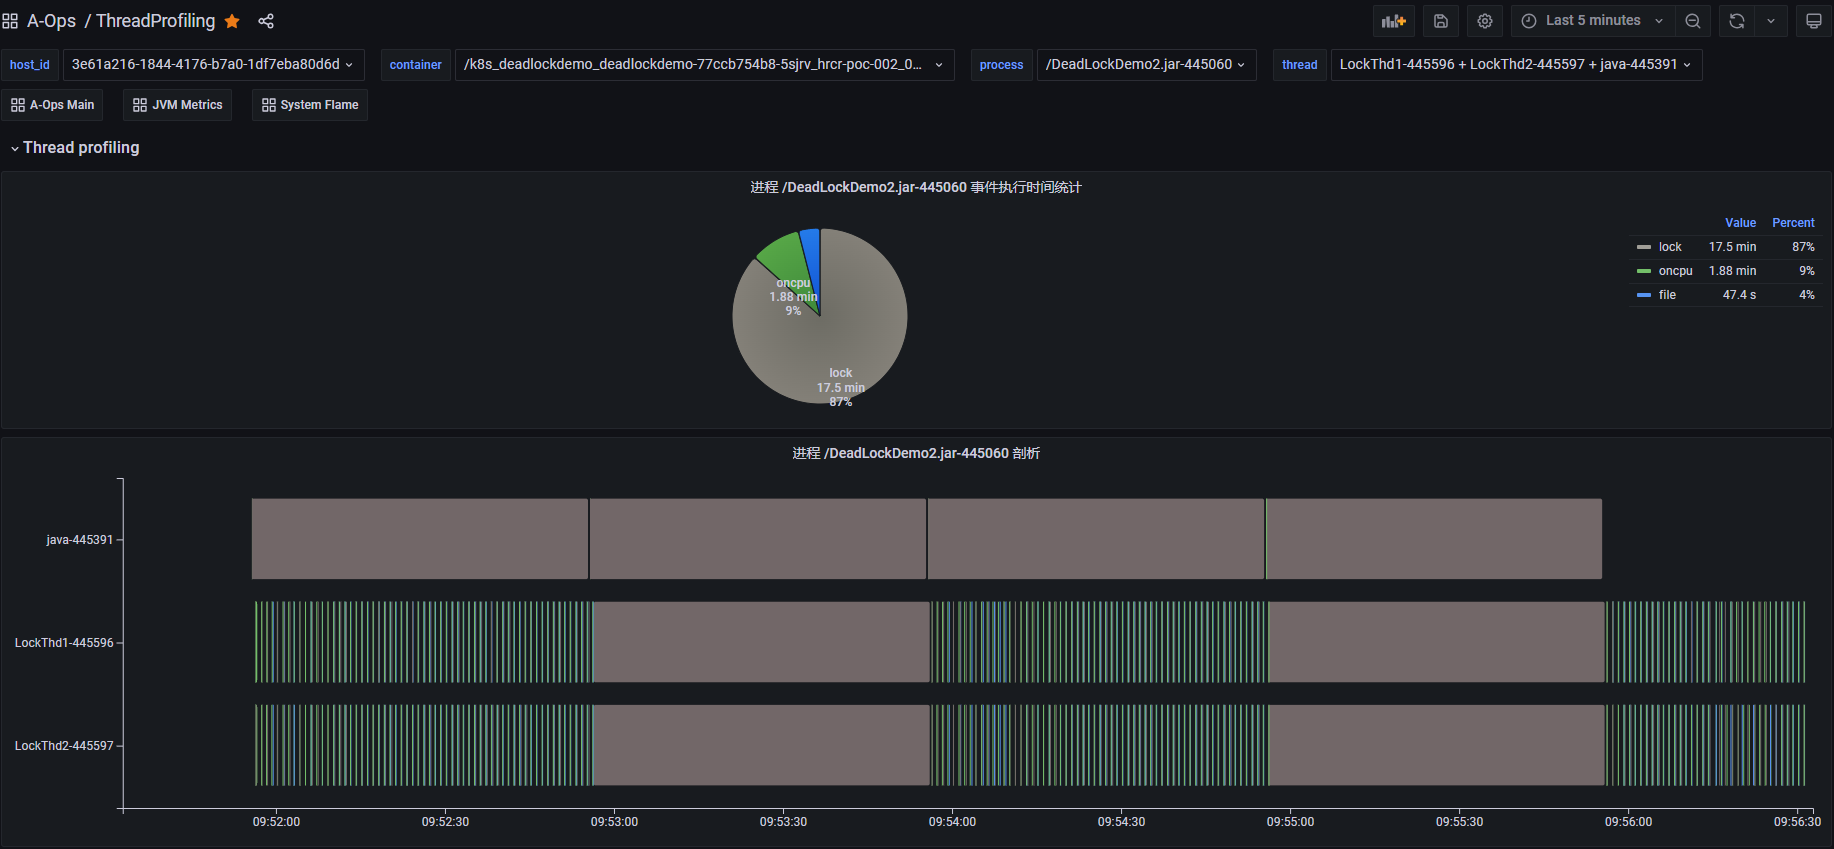
This suggests potential issues with LockThd1 and LockThd2. We can examine their thread profiling results in the thread view.
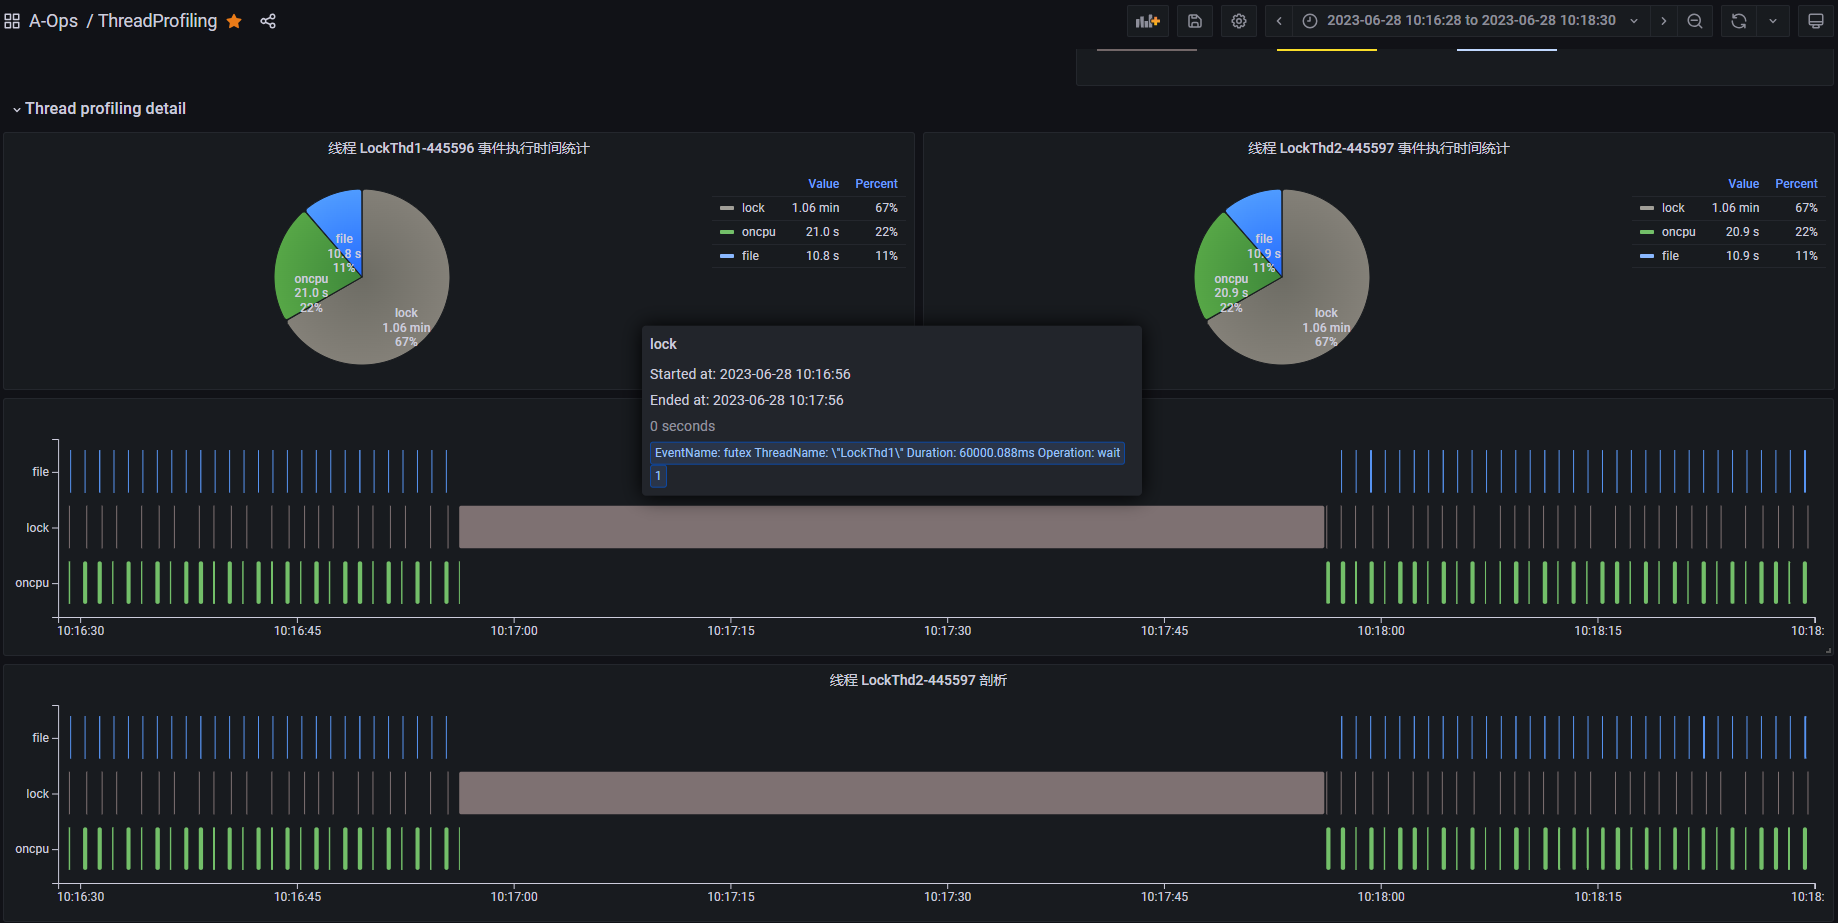
This view displays the profiling results for each thread, with the vertical axis showing the sequence of events. LockThd1 and LockThd2 normally execute oncpu events, including file and lock events, periodically. However, around 10:17:00, they both execute a long futex event without any intervening oncpu events, indicating a blocked state. futex is a syscall related to user-space lock implementation, and its invocation often signals lock contention and potential blocking.
Based on this analysis, a deadlock likely exists between LockThd1 and LockThd2.
Case 2: Lock Contention Detection
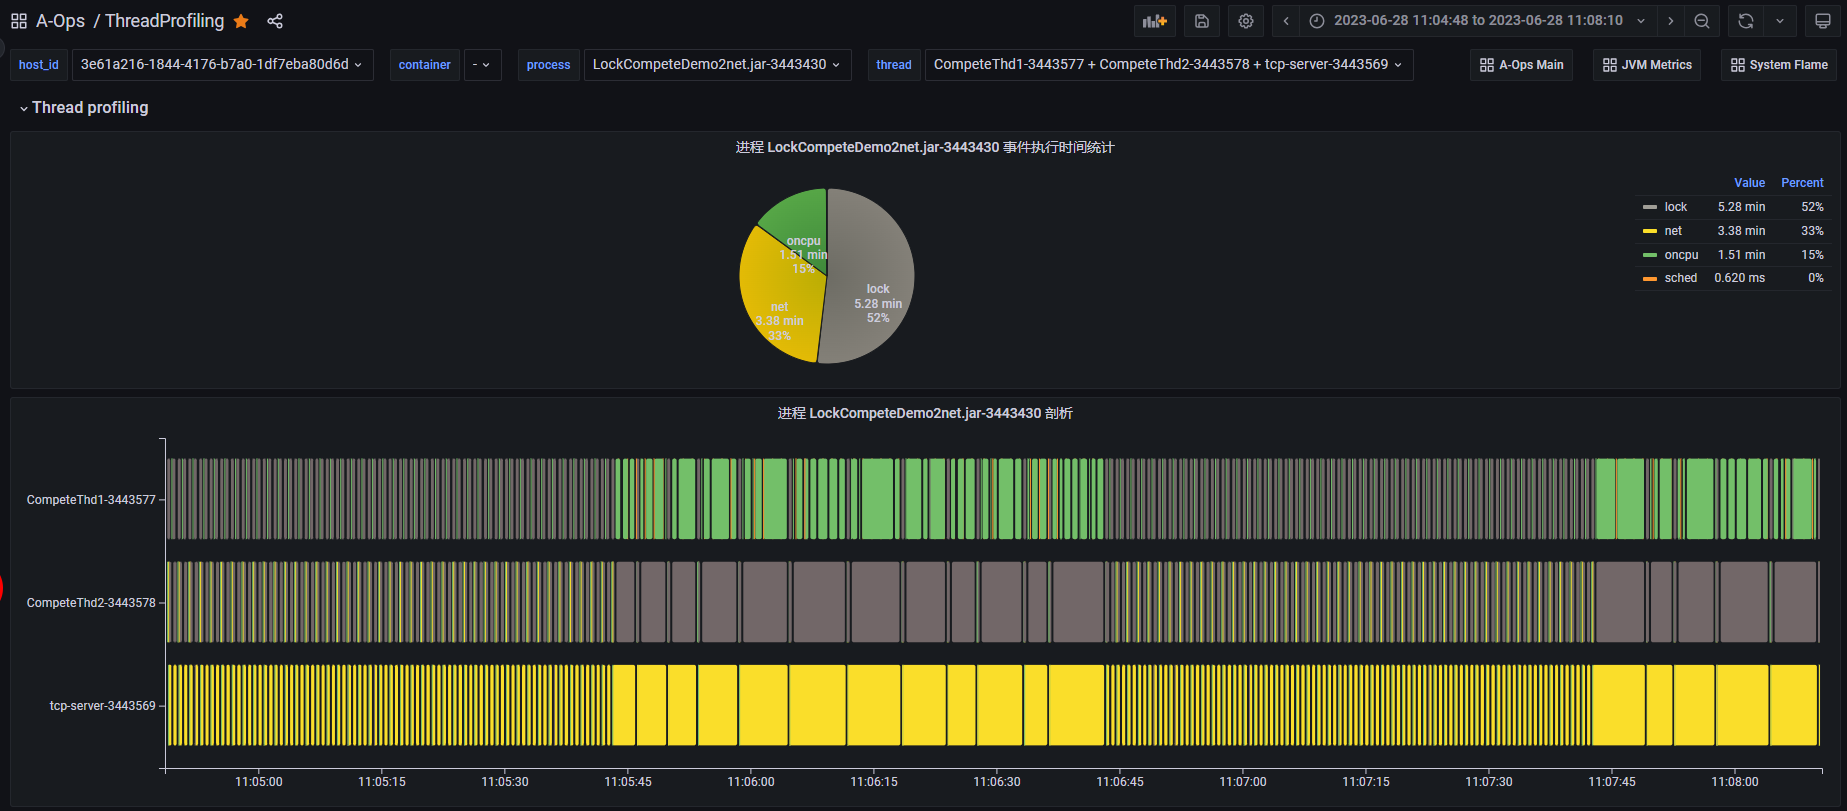
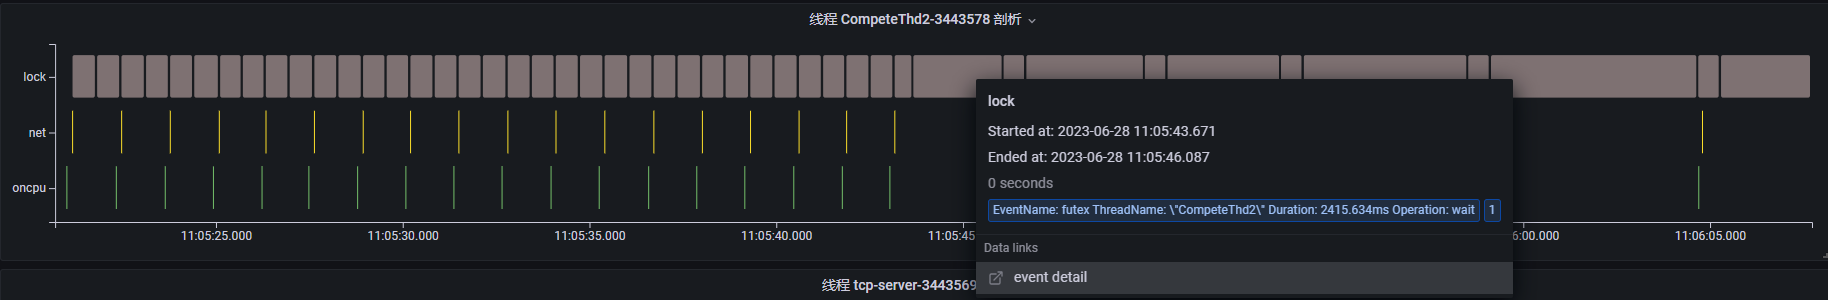
The above diagram shows the thread profiling results for a lock contention demo process. The process primarily executes lock, net, and oncpu events, involving three service threads. Between 11:05:45 and 11:06:45, the event execution times for all three threads increase significantly, indicating a potential performance problem. We can examine each thread's profiling results in the thread view, focusing on this period.
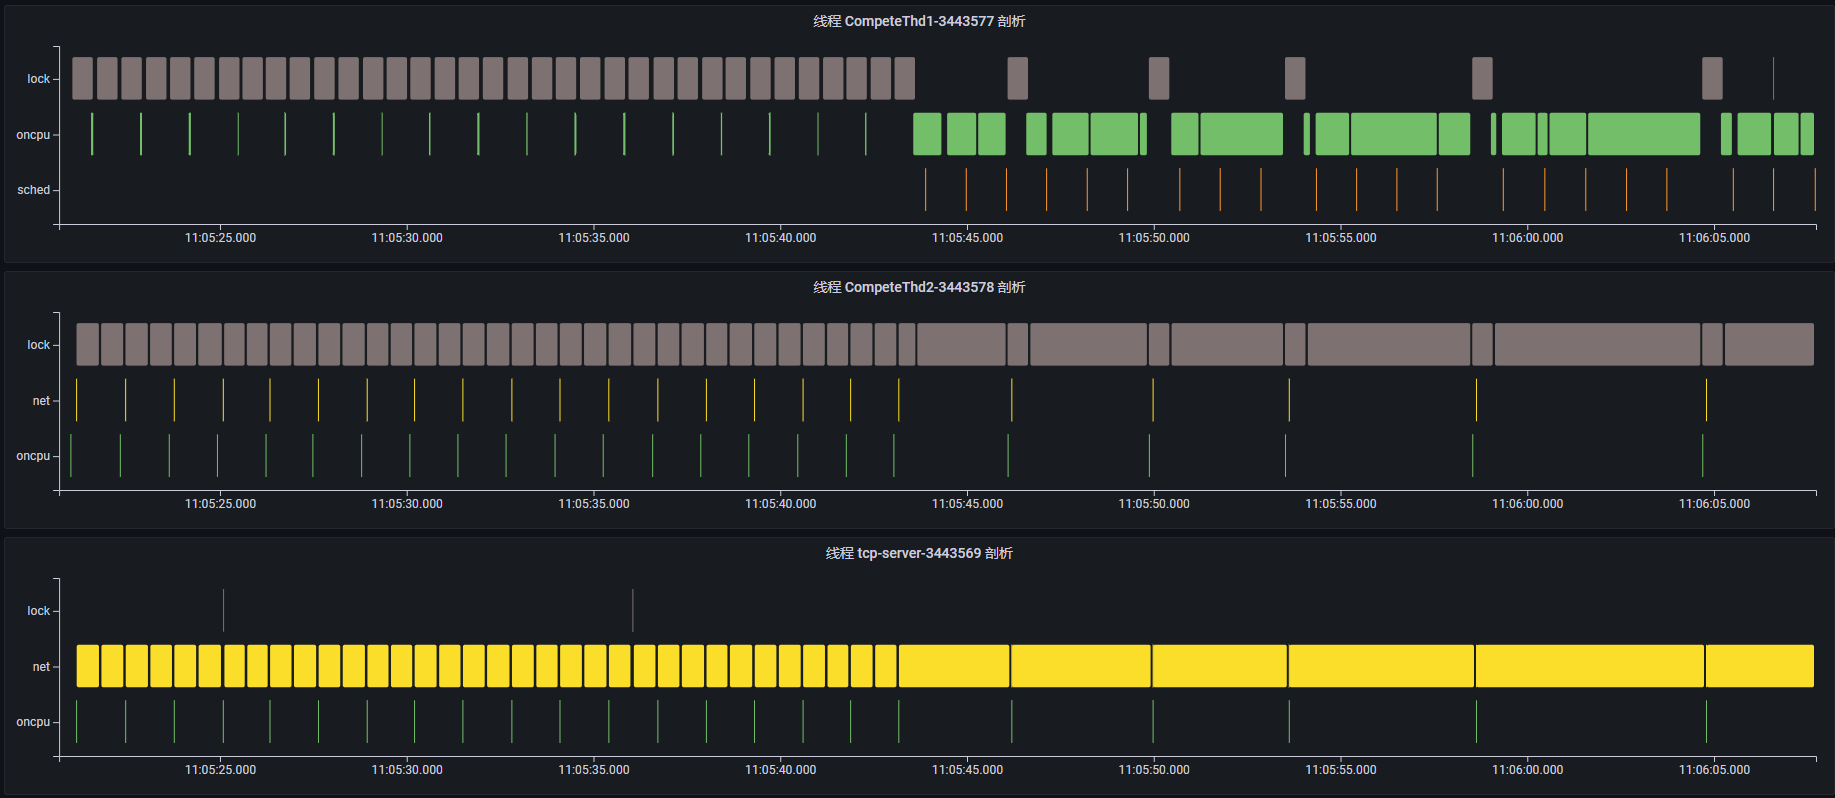
By examining the event sequence for each thread, we can understand their activities:
Thread
CompeteThd1: Periodically triggers shortoncpuevents, performing a calculation task. However, around 11:05:45, it begins triggering longoncpuevents, indicating a time-consuming calculation.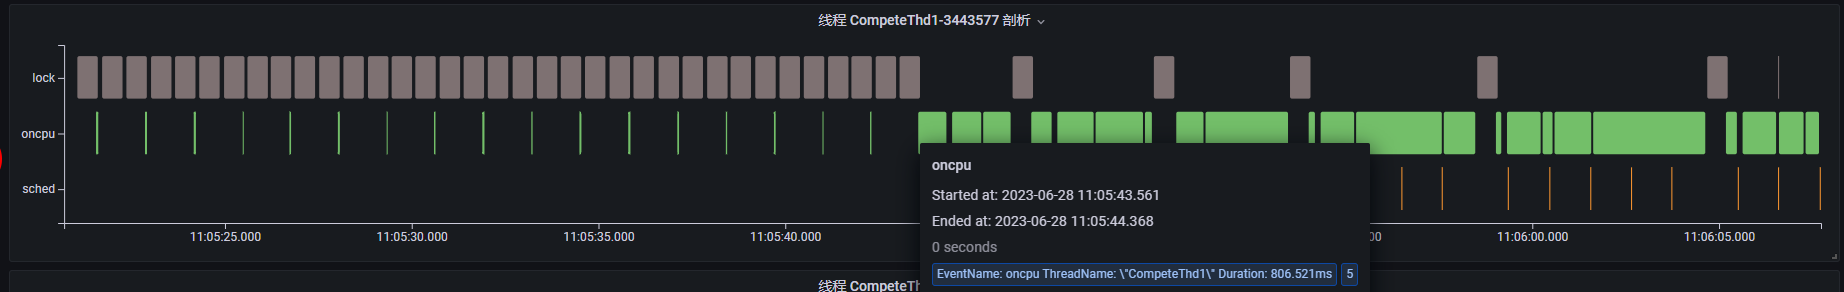
Thread
CompeteThd2: Periodically triggers shortnetevents. Clicking on an event reveals that the thread is sending network messages via thewritesyscall, along with the TCP connection details. Similarly, around 11:05:45, it starts executing longfutexevents and becomes blocked, increasing the interval betweenwriteevents.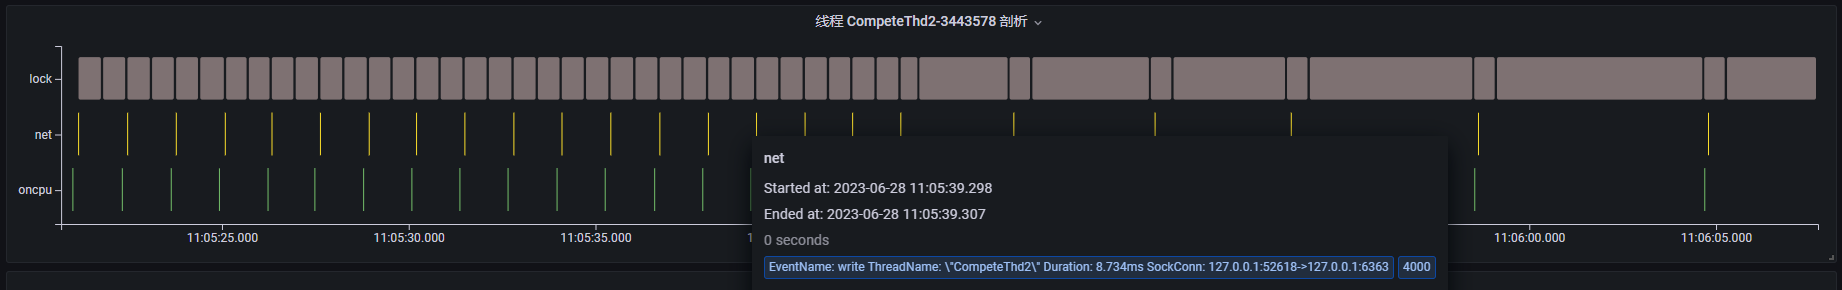
Thread
tcp-server: A TCP server that continuously reads client requests via thereadsyscall. Starting around 11:05:45, thereadevent execution time increases, indicating that it is waiting to receive network requests.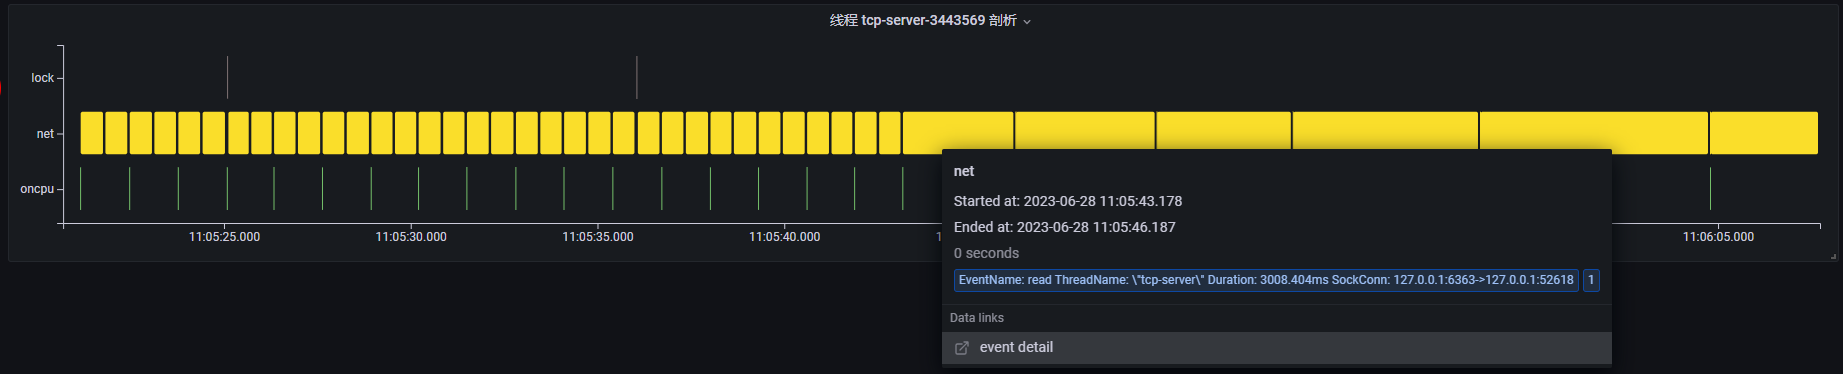
Based on this analysis, whenever CompeteThd1 performs a long oncpu operation, CompeteThd2 calls futex and enters a blocked state. Once CompeteThd1 completes the oncpu operation, CompeteThd2 acquires the CPU and performs the network write operation. This strongly suggests lock contention between CompeteThd1 and CompeteThd2. Because CompeteThd2 is waiting for a lock and cannot send network requests, the tcp-server thread spends most of its time waiting for read requests.
Topics
Supported System Call Events
When selecting system call events for monitoring, consider these principles:
- Choose potentially time-consuming or blocking events, such as file, network, or lock operations, as they involve system resource access.
- Choose events that affect a thread's running state.
| Event/Syscall Name | Description | Default Type | Extended Content |
|---|---|---|---|
read | Reads/writes to drive files or the network; may be time-consuming or blocking. | file | file.path, sock.conn, func.stack |
write | Reads/writes to drive files or the network; may be time-consuming or blocking. | file | file.path, sock.conn, func.stack |
readv | Reads/writes to drive files or the network; may be time-consuming or blocking. | file | file.path, sock.conn, func.stack |
writev | Reads/writes to drive files or the network; may be time-consuming or blocking. | file | file.path, sock.conn, func.stack |
preadv | Reads/writes to drive files or the network; may be time-consuming or blocking. | file | file.path, sock.conn, func.stack |
pwritev | Reads/writes to drive files or the network; may be time-consuming or blocking. | file | file.path, sock.conn, func.stack |
sync | Synchronously flushes files to the drive; blocks the thread until completion. | file | func.stack |
fsync | Synchronously flushes files to the drive; blocks the thread until completion. | file | file.path, sock.conn, func.stack |
fdatasync | Synchronously flushes files to the drive; blocks the thread until completion. | file | file.path, sock.conn, func.stack |
sched_yield | Thread voluntarily relinquishes the CPU for rescheduling. | sched | func.stack |
nanosleep | Thread enters a sleep state. | sched | func.stack |
clock_nanosleep | Thread enters a sleep state. | sched | func.stack |
wait4 | Thread blocks. | sched | func.stack |
waitpid | Thread blocks. | sched | func.stack |
select | Thread blocks and waits for an event. | sched | func.stack |
pselect6 | Thread blocks and waits for an event. | sched | func.stack |
poll | Thread blocks and waits for an event. | sched | func.stack |
ppoll | Thread blocks and waits for an event. | sched | func.stack |
epoll_wait | Thread blocks and waits for an event. | sched | func.stack |
sendto | Reads/writes to the network; may be time-consuming or blocking. | net | sock.conn, func.stack |
recvfrom | Reads/writes to the network; may be time-consuming or blocking. | net | sock.conn, func.stack |
sendmsg | Reads/writes to the network; may be time-consuming or blocking. | net | sock.conn, func.stack |
recvmsg | Reads/writes to the network; may be time-consuming or blocking. | net | sock.conn, func.stack |
sendmmsg | Reads/writes to the network; may be time-consuming or blocking. | net | sock.conn, func.stack |
recvmmsg | Reads/writes to the network; may be time-consuming or blocking. | net | sock.conn, func.stack |
futex | Often indicates lock contention; the thread may block. | lock | futex.op, func.stack |
Aggregated Events
tprofiling currently supports two main categories of system performance events: system call events and oncpu events. In certain scenarios, oncpu events and some system call events (like read and write) can trigger frequently, generating a large volume of system events. This can negatively impact both the performance of the application being observed and the tprofiling probe itself.
To improve performance, tprofiling aggregates multiple system events with the same name from the same thread within a one-second interval into a single reported event. Therefore, a tprofiling event is actually an aggregated event containing one or more identical system events. Some attribute meanings differ between aggregated events and real system events:
start_time: The start time of the first system event in the aggregation.end_time: Calculated asstart_time + duration.duration: The sum of the actual execution times of all system events in the aggregation.count: The number of system events aggregated. Whencountis 1, the aggregated event is equivalent to a single system event.- Extended event attributes: The extended attributes of the first system event in the aggregation.
Introduction to L7Probe
Purpose: L7 traffic observation, covering common protocols like HTTP1.X, PG, MySQL, Redis, Kafka, HTTP2.0, MongoDB, and RocketMQ. Supports observation of encrypted streams.
Scope: Node, container, and Kubernetes pod environments.
Code Framework Design
L7Probe
    | --- included  // Public header files
        | --- connect.h   // L7 connect object definition
        | --- pod.h   // pod/container object definition
        | --- conn_tracker.h   // L7 protocol tracking object definition
    | --- protocol  // L7 protocol parsing
        | --- http   // HTTP1.X L7 message structure definition and parsing
        | --- mysql // mysql L7 message structure definition and parsing
        | --- pgsql // pgsql L7 message structure definition and parsing
    | --- bpf  // Kernel bpf code
        | --- L7.h   // BPF program parses L7 protocol types
        | --- kern_sock.bpf.c   // Kernel socket layer observation
        | --- libssl.bpf.c   // OpenSSL layer observation
        | --- gossl.bpf.c   // Go SSL layer observation
        | --- cgroup.bpf.c   // Pod lifecycle observation
    | --- pod_mng.c   // pod/container instance management (detects pod/container lifecycle)
    | --- conn_mng.c   // L7 Connect instance management (handles BPF observation events, such as Open/Close events, Stats statistics)
    | --- conn_tracker.c   // L7 traffic tracking (tracks data from BPF observation, such as data generated by send/write, read/recv system events)
    | --- bpf_mng.c   // BPF program lifecycle management (dynamically opens, loads, attaches, and unloads BPF programs, including uprobe BPF programs)
    | --- session_conn.c   // Manages JSSE sessions (records the mapping between JSSE sessions and socket connections, and reports JSSE connection information)
    | --- L7Probe.c   // Main probe program
Probe Output
| Metric Name | Table Name | Metric Type | Unit | Metric Description |
|---|---|---|---|---|
| tgid | N/A | Key | N/A | Process ID of the L7 session. |
| client_ip | N/A | Key | N/A | Client IP address of the L7 session. |
| server_ip | N/A | Key | N/A | Server IP address of the L7 session. Note: In Kubernetes, Cluster IP addresses can be translated to Backend IP addresses. |
| server_port | N/A | Key | N/A | Server port of the L7 session. Note: In Kubernetes, Cluster Ports can be translated to Backend Ports. |
| l4_role | N/A | Key | N/A | Role of the L4 protocol (TCP Client/Server or UDP). |
| l7_role | N/A | Key | N/A | Role of the L7 protocol (Client or Server). |
| protocol | N/A | Key | N/A | Name of the L7 protocol (HTTP/HTTP2/MySQL...). |
| ssl | N/A | Label | N/A | Indicates whether the L7 session uses SSL encryption. |
| bytes_sent | l7_link | Gauge | N/A | Number of bytes sent by the L7 session. |
| bytes_recv | l7_link | Gauge | N/A | Number of bytes received by the L7 session. |
| segs_sent | l7_link | Gauge | N/A | Number of segments sent by the L7 session. |
| segs_recv | l7_link | Gauge | N/A | Number of segments received by the L7 session. |
| throughput_req | l7_rpc | Gauge | QPS | Request throughput of the L7 session. |
| throughput_resp | l7_rpc | Gauge | QPS | Response throughput of the L7 session. |
| req_count | l7_rpc | Gauge | N/A | Request count of the L7 session. |
| resp_count | l7_rpc | Gauge | N/A | Response count of the L7 session. |
| latency_avg | l7_rpc | Gauge | ns | Average latency of the L7 session. |
| latency | l7_rpc | Histogram | ns | Latency histogram of the L7 session. |
| latency_sum | l7_rpc | Gauge | ns | Total latency of the L7 session. |
| err_ratio | l7_rpc | Gauge | % | Error rate of the L7 session. |
| err_count | l7_rpc | Gauge | N/A | Error count of the L7 session. |
Dynamic Control
Controlling the Scope of Pod Observation
- REST request sent to gala-gopher.
- gala-gopher forwards the request to L7Probe.
- L7Probe identifies relevant containers based on the Pod information.
- L7Probe retrieves the CGroup ID (
cpuacct_cgrp_id) of each container and writes it to the object module (using thecgrp_addAPI). - During socket system event processing, the CGroup (
cpuacct_cgrp_id) of the process is obtained, referencing the Linux kernel code (task_cgroup). - Filtering occurs during observation via the object module (using the
is_cgrp_existAPI).
Controlling Observation Capabilities
- REST request sent to gala-gopher.
- gala-gopher forwards the request to L7Probe.
- L7Probe dynamically enables or disables BPF-based observation features (including throughput, latency, tracing, and protocol type detection) based on the request parameters.
Observation Points
Kernel Socket System Calls
TCP-related system calls:
// int connect(int sockfd, const struct sockaddr *addr, socklen_t addrlen);
// int accept(int sockfd, struct sockaddr *addr, socklen_t *addrlen);
// int accept4(int sockfd, struct sockaddr *addr, socklen_t *addrlen, int flags);
// ssize_t write(int fd, const void *buf, size_t count);
// ssize_t send(int sockfd, const void *buf, size_t len, int flags);
// ssize_t read(int fd, void *buf, size_t count);
// ssize_t recv(int sockfd, void *buf, size_t len, int flags);
// ssize_t writev(int fd, const struct iovec *iov, int iovcnt);
// ssize_t readv(int fd, const struct iovec *iov, int iovcnt);
TCP and UDP-related system calls:
// ssize_t sendto(int sockfd, const void *buf, size_t len, int flags, const struct sockaddr *dest_addr, socklen_t addrlen);
// ssize_t recvfrom(int sockfd, void *buf, size_t len, int flags, struct sockaddr *src_addr, socklen_t *addrlen);
// ssize_t sendmsg(int sockfd, const struct msghdr *msg, int flags);
// ssize_t recvmsg(int sockfd, struct msghdr *msg, int flags);
// int close(int fd);
Important notes:
read/writeandreadv/writevcan be confused with regular file I/O. The kernel functionsecurity_socket_sendmsgis observed to determine if a file descriptor (FD) refers to a socket operation.sendto/recvfromandsendmsg/recvmsgare used by both TCP and UDP. Refer to the manuals below.sendmmsg/recvmmsgandsendfileare not currently supported.
sendto manual: If sendto() is used on a connection-mode (SOCK_STREAM, SOCK_SEQPACKET) socket, the arguments dest_addr and addrlen are ignored (and the error EISCONN may be returned when they are not NULL and 0), and the error ENOTCONN is returned when the socket was not actually connected. otherwise, the address of the target is given by dest_addr with addrlen specifying its size.
sendto determines that the protocol is TCP if the dest_addr parameter is NULL; otherwise, it is UDP.
recvfrom manual: The recvfrom() and recvmsg() calls are used to receive messages from a socket, and may be used to receive data on a socket whether or not it is connection-oriented.
recvfrom determines that the protocol is TCP if the src_addr parameter is NULL; otherwise, it is UDP.
sendmsg manual: The sendmsg() function shall send a message through a connection-mode or connectionless-mode socket. If the socket is a connectionless-mode socket, the message shall be sent to the address specified by msghdr if no pre-specified peer address has been set. If a peer address has been pre-specified, either themessage shall be sent to the address specified in msghdr (overriding the pre-specified peer address), or the function shall return -1 and set errno to [EISCONN]. If the socket is connection-mode, the destination address in msghdr shall be ignored.
sendmsg determines that the protocol is TCP if msghdr->msg_name is NULL; otherwise, it is UDP.
recvmsg manual: The recvmsg() function shall receive a message from a connection-mode or connectionless-mode socket. It is normally used with connectionless-mode sockets because it permits the application to retrieve the source address of received data.
recvmsg determines that the protocol is TCP if msghdr->msg_name is NULL; otherwise, it is UDP.
libSSL API
SSL_write
SSL_read
Go SSL API
JSSE API
sun/security/ssl/SSLSocketImpl$AppInputStream
sun/security/ssl/SSLSocketImpl$AppOutputStream
JSSE Observation Scheme
Loading the JSSEProbe
The l7_load_jsse_agent function in main loads the JSSEProbe.
It polls processes in the whitelist (g_proc_obj_map_fd). If a process is a Java process, it uses jvm_attach to load JSSEProbeAgent.jar into it. After loading, the Java process outputs observation information to /tmp/java-data-<pid>/jsse-metrics.txt at specific points (see JSSE API).
Processing JSSEProbe Messages
The l7_jsse_msg_handler thread handles JSSEProbe messages.
It polls processes in the whitelist (g_proc_obj_map_fd). If a process has a jsse-metrics output file, it reads the file line by line, then parses, converts, and reports JSSE read/write information.
1. Parsing JSSE Read/Write Information
The jsse-metrics.txt output format is:
|jsse_msg|662220|Session(1688648699909|TLS_AES_256_GCM_SHA384)|1688648699989|Write|127.0.0.1|58302|This is test message|It parses the process ID, session ID, time, read/write operation, IP address, port, and payload.
The parsed information is stored in session_data_args_s.
2. Converting JSSE Read/Write Information
It converts the information in session_data_args_s into sock_conn and conn_data.
This conversion queries two hash maps:
session_head: Records the mapping between the JSSE session ID and the socket connection ID. If the process ID and 4-tuple information match, the session and socket connection are linked.
file_conn_head: Records the last session ID of the Java process, in case L7Probe doesn't start reading from the beginning of a request and can't find the session ID.
3. Reporting JSSE Read/Write Information
It reports sock_conn and conn_data to the map.
sliprobe Introduction
sliprobe uses eBPF to collect and report container-level service-level indicator (SLI) metrics periodically.
Features
- Collects the total latency and statistical histogram of CPU scheduling events per container. Monitored events include scheduling wait, active sleep, lock/IO blocking, scheduling delay, and long system calls.
- Collects the total latency and statistical histogram of memory allocation events per container. Monitored events include memory reclamation, swapping, and memory compaction.
- Collects the total latency and statistical histogram of BIO layer I/O operations per container.
Usage Instructions
Example command to start sliprobe: Specifies a reporting period of 15 seconds and observes SLI metrics for containers abcd12345678 and abcd87654321.
curl -X PUT http://localhost:9999/sli -d json='{"params":{"report_period":15}, "snoopers":{"container_id":[{"container_id": "abcd12345678","abcd87654321"}]}, "state":"running"}'Code Logic
Overview
- The user-space application receives a list of containers to monitor and stores the inode of each container's
cpuacctsubsystem directory in an eBPF map, sharing it with the kernel. - The kernel traces relevant kernel events using eBPF kprobes/tracepoints, determines if the event belongs to a monitored container, and records the event type and timestamp. It aggregates and reports SLI metrics for processes in the same cgroup at regular intervals.
- The user-space application receives and prints the SLI metrics reported by the kernel.
How SLI Metrics Are Calculated
CPU SLI
cpu_wait
At the
sched_stat_waittracepoint, get thedelayvalue (second parameter).cpu_sleep
At the
sched_stat_sleeptracepoint, get thedelayvalue (second parameter).cpu_iowait
At the
sched_stat_blockedtracepoint, if the current process isin_iowait, get thedelayvalue (second parameter).cpu_block
At the
sched_stat_blockedtracepoint, if the current process is notin_iowait, get thedelayvalue (second parameter).cpu_rundelay
At the
sched_switchtracepoint, get therun_delayvalue of the next scheduled process (next->sched_info.run_delay) from the third parameternextand store it intask_sched_map. Calculate the difference inrun_delaybetween two scheduling events of the same process.cpu_longsys
At the
sched_switchtracepoint, get thetaskstructure of the next scheduled process from the third parameternext. Obtain the number of context switches (nvcsw+nivcsw) and user-space execution time (utime) from thetaskstructure. If the number of context switches and user-space execution time remain the same between two scheduling events of the same process, the process is assumed to be executing a long system call. Accumulate the time the process spends in kernel mode.
MEM SLI
mem_reclaim
Calculate the difference between the return and entry timestamps of the
mem_cgroup_handle_over_highfunction.Calculate the difference between the timestamps of the
mm_vmscan_memcg_reclaim_endandmm_vmscan_memcg_reclaim_begintracepoints.mem_swapin
Calculate the difference between the return and entry timestamps of the
do_swap_pagefunction.mem_compact
Calculate the difference between the return and entry timestamps of the
try_to_compact_pagesfunction.
IO SLI
bio_latency
Calculate the timestamp difference between entering the
bio_endiofunction and triggering theblock_bio_queuetracepoint.Calculate the timestamp difference between entering the
bio_endiofunction and exiting thegeneric_make_request_checksfunction.
Output Data
Metric
Prometheus Server has a built-in Express Browser UI. You can use PromQL statements to query metric data. For details, see Using the expression browser in the official document. The following is an example.
If the specified metric is
gala_gopher_tcp_link_rcv_rtt, the metric data displayed on the UI is as follows:basicgala_gopher_tcp_link_rcv_rtt{client_ip="x.x.x.165",client_port="1234",hostname="openEuler",instance="x.x.x.172:8888",job="prometheus",machine_id="1fd3774xx",protocol="2",role="0",server_ip="x.x.x.172",server_port="3742",tgid="1516"} 1Metadata
You can directly consume data from the Kafka topic
gala_gopher_metadata. The following is an example.bash# Input request ./bin/kafka-console-consumer.sh --bootstrap-server x.x.x.165:9092 --topic gala_gopher_metadata # Output data {"timestamp": 1655888408000, "meta_name": "thread", "entity_name": "thread", "version": "1.0.0", "keys": ["machine_id", "pid"], "labels": ["hostname", "tgid", "comm", "major", "minor"], "metrics": ["fork_count", "task_io_wait_time_us", "task_io_count", "task_io_time_us", "task_hang_count"]}Abnormal events
You can directly consume data from the Kafka topic
gala_gopher_event. The following is an example.bash# Input request ./bin/kafka-console-consumer.sh --bootstrap-server x.x.x.165:9092 --topic gala_gopher_event # Output data {"timestamp": 1655888408000, "meta_name": "thread", "entity_name": "thread", "version": "1.0.0", "keys": ["machine_id", "pid"], "labels": ["hostname", "tgid", "comm", "major", "minor"], "metrics": ["fork_count", "task_io_wait_time_us", "task_io_count", "task_io_time_us", "task_hang_count"]}
Licensed under the MulanPSL2
 J.G.W.A.B. No. 11030102011597