AOps Intelligent Positioning Framework User Manual
After the AOps frontend and backend services are deployed by referring to AOps Deployment Guide, you can use the AOps intelligent positioning framework.
The following sections describe the functions of the AOps intelligent positioning framework from the perspective of pages.
Workbench
This page is the data dashboard page, which is displayed after a user logs in.
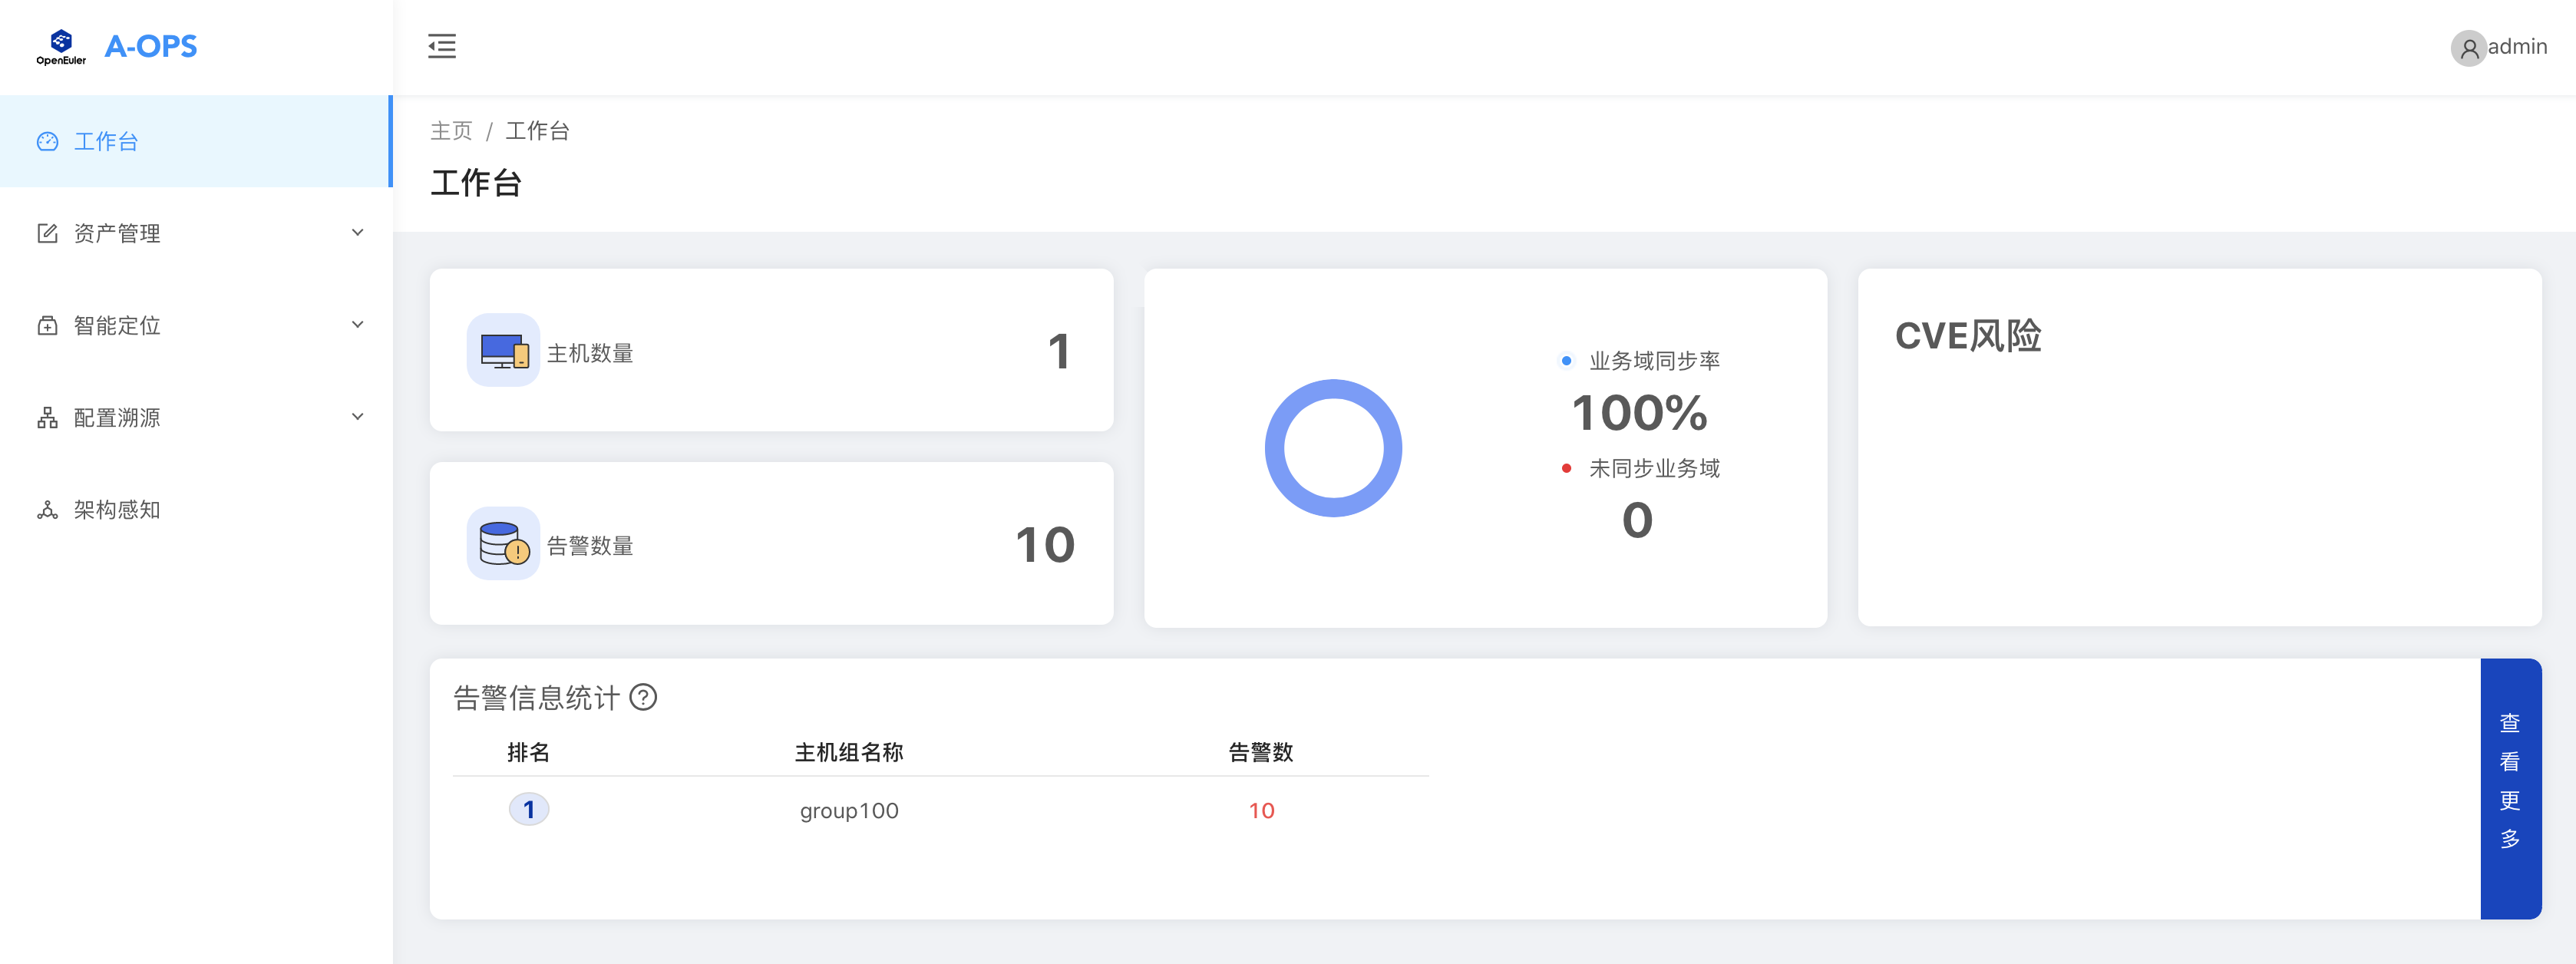
Supported operations:
Number of hosts currently managed
Number of all current unacknowledged alarms
Statistics on alarms of each host group
User account operations
- Changing the password
- Logging out
Service domains and CVE information are not supported currently.
Asset Management
Asset management consists of host group management and host management. Each host needs to be registered with an existing host group on the agent side, and the host is displayed on the frontend after registration.
(1) Host Group page:
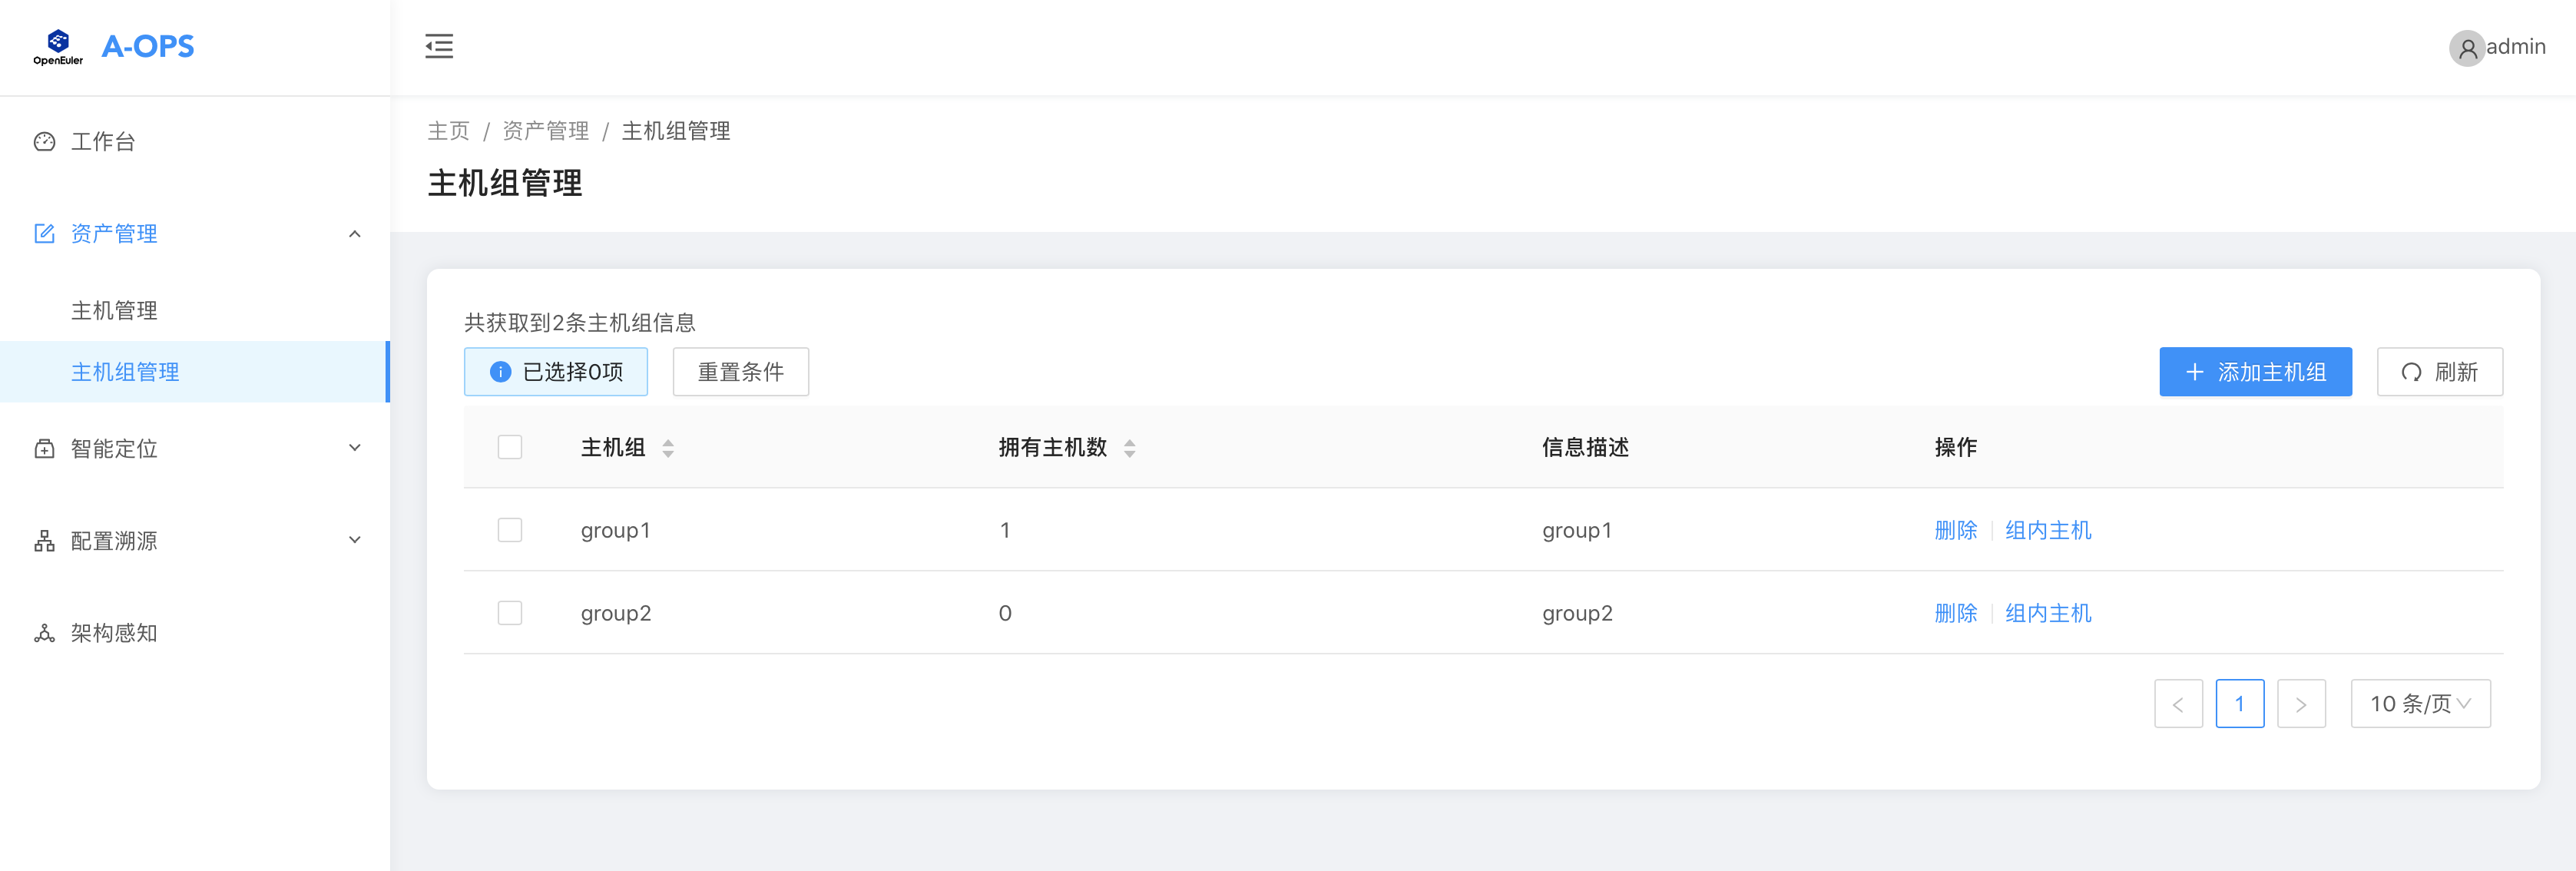
The following operations are supported:
- Adding a host group
- Deleting a host group
- Viewing all current host groups
- Viewing host information in each host group
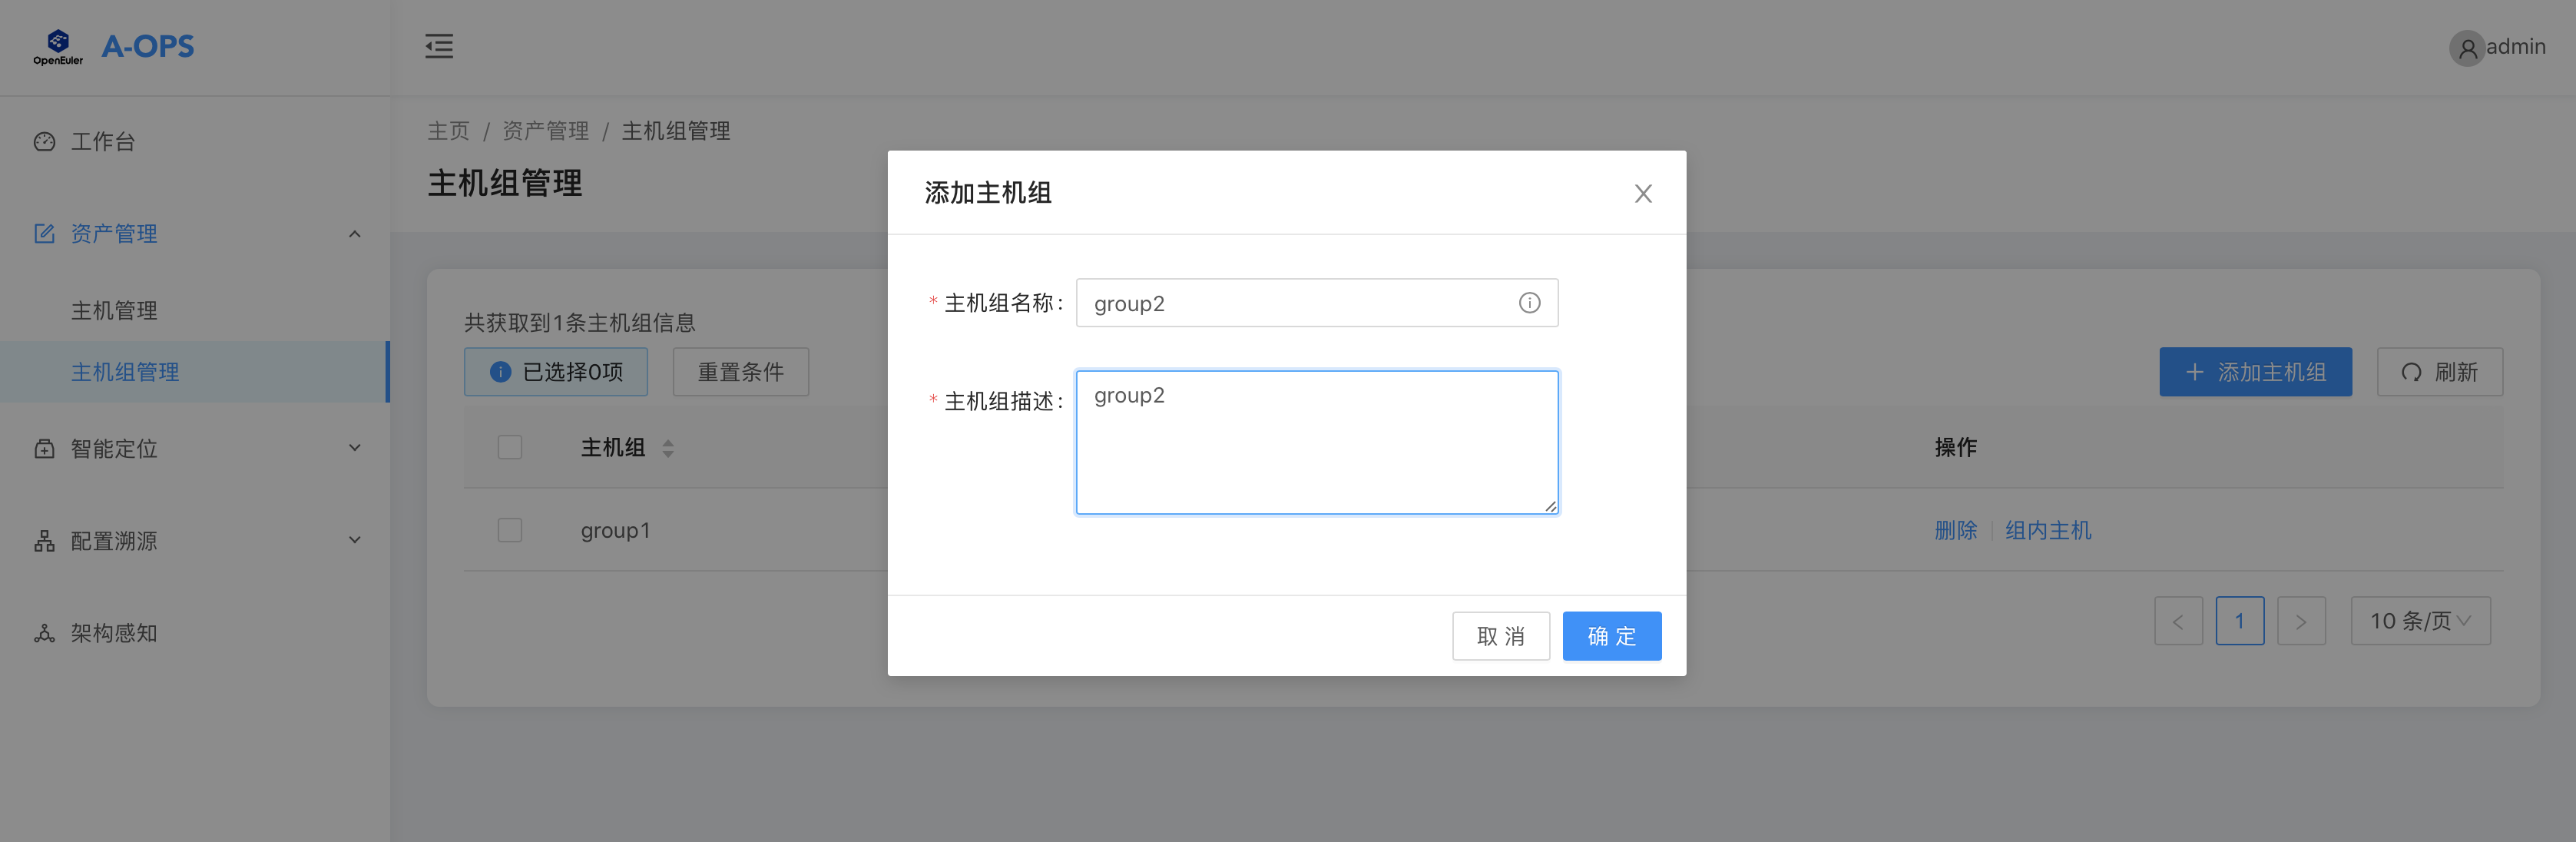
When adding a host group, you must specify the name and description of the host group. Note: Do not use duplicate names.
(2) Host Management page:
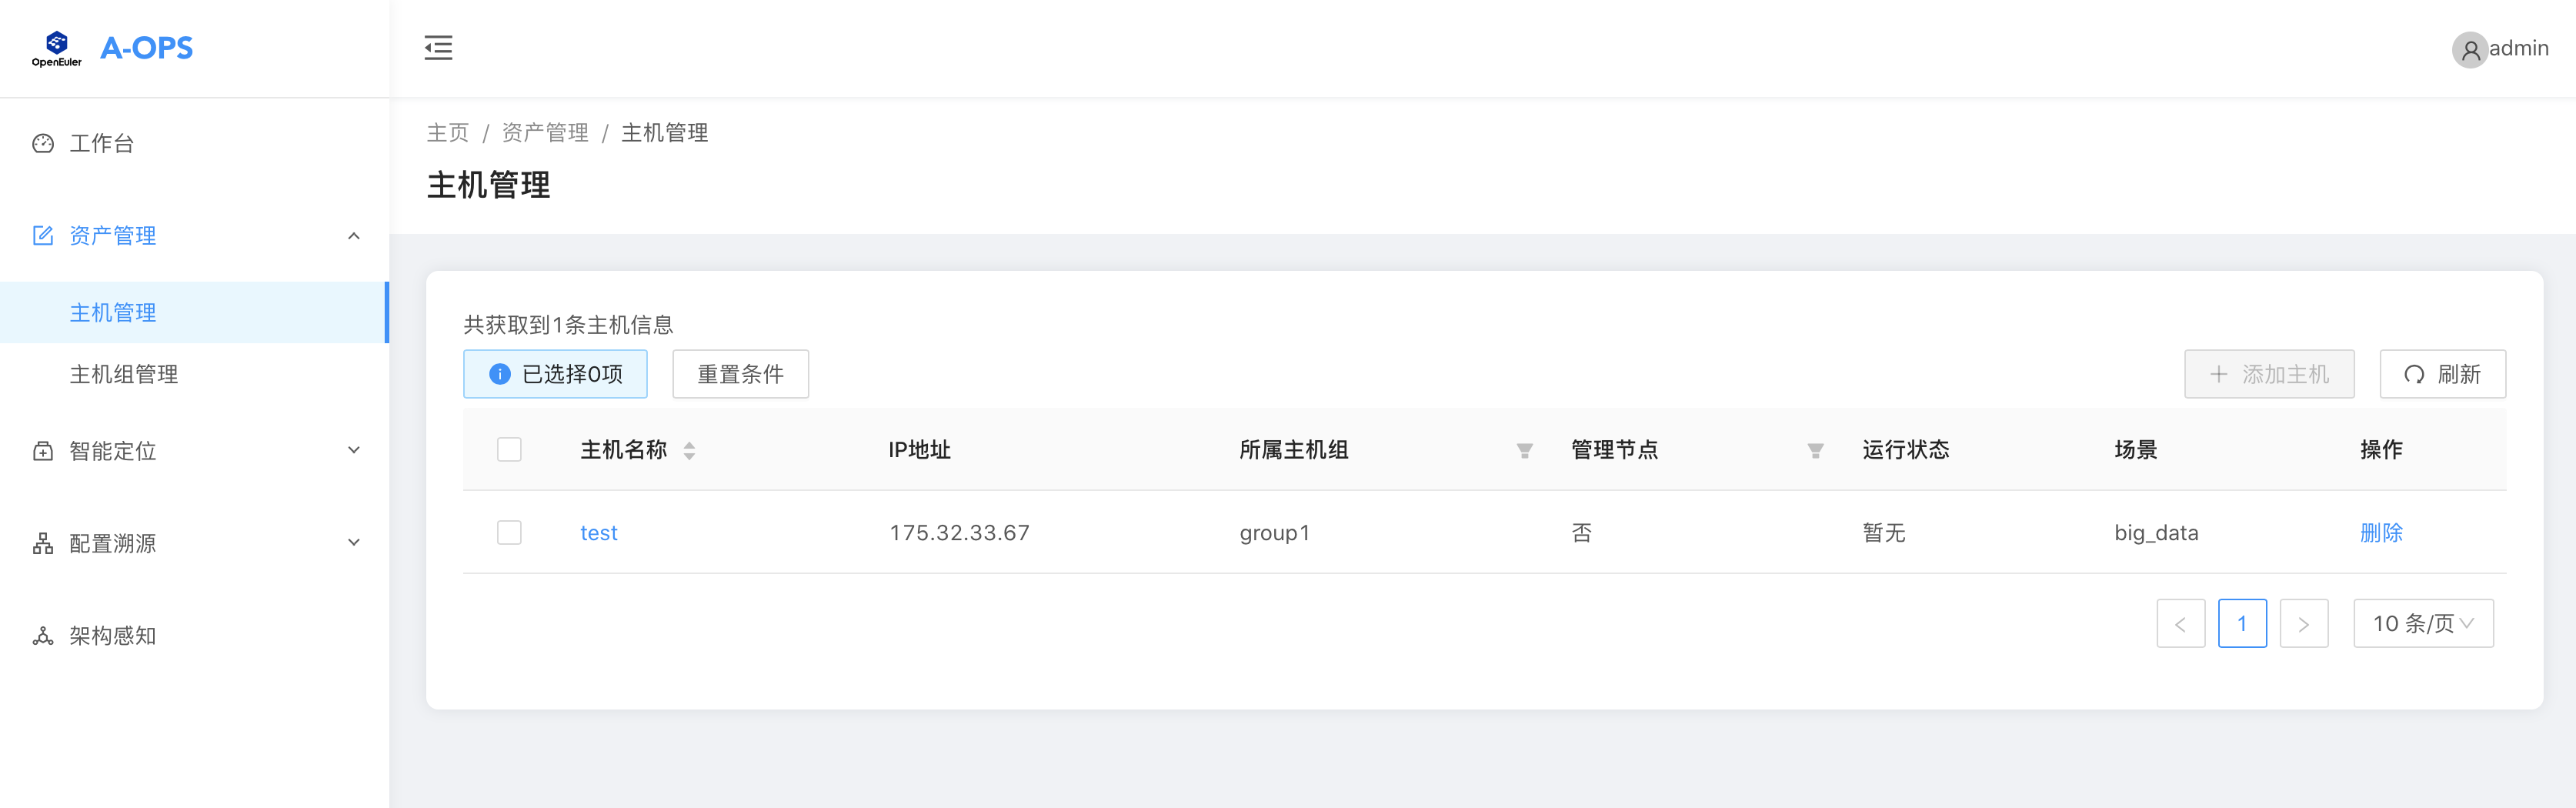
The following operations are supported:
- Viewing the host list (you can filter hosts by host group and management node, and sort hosts by host name)
- Deleting a host
- Clicking a host to switch to the host details page
(3) Host Details page:
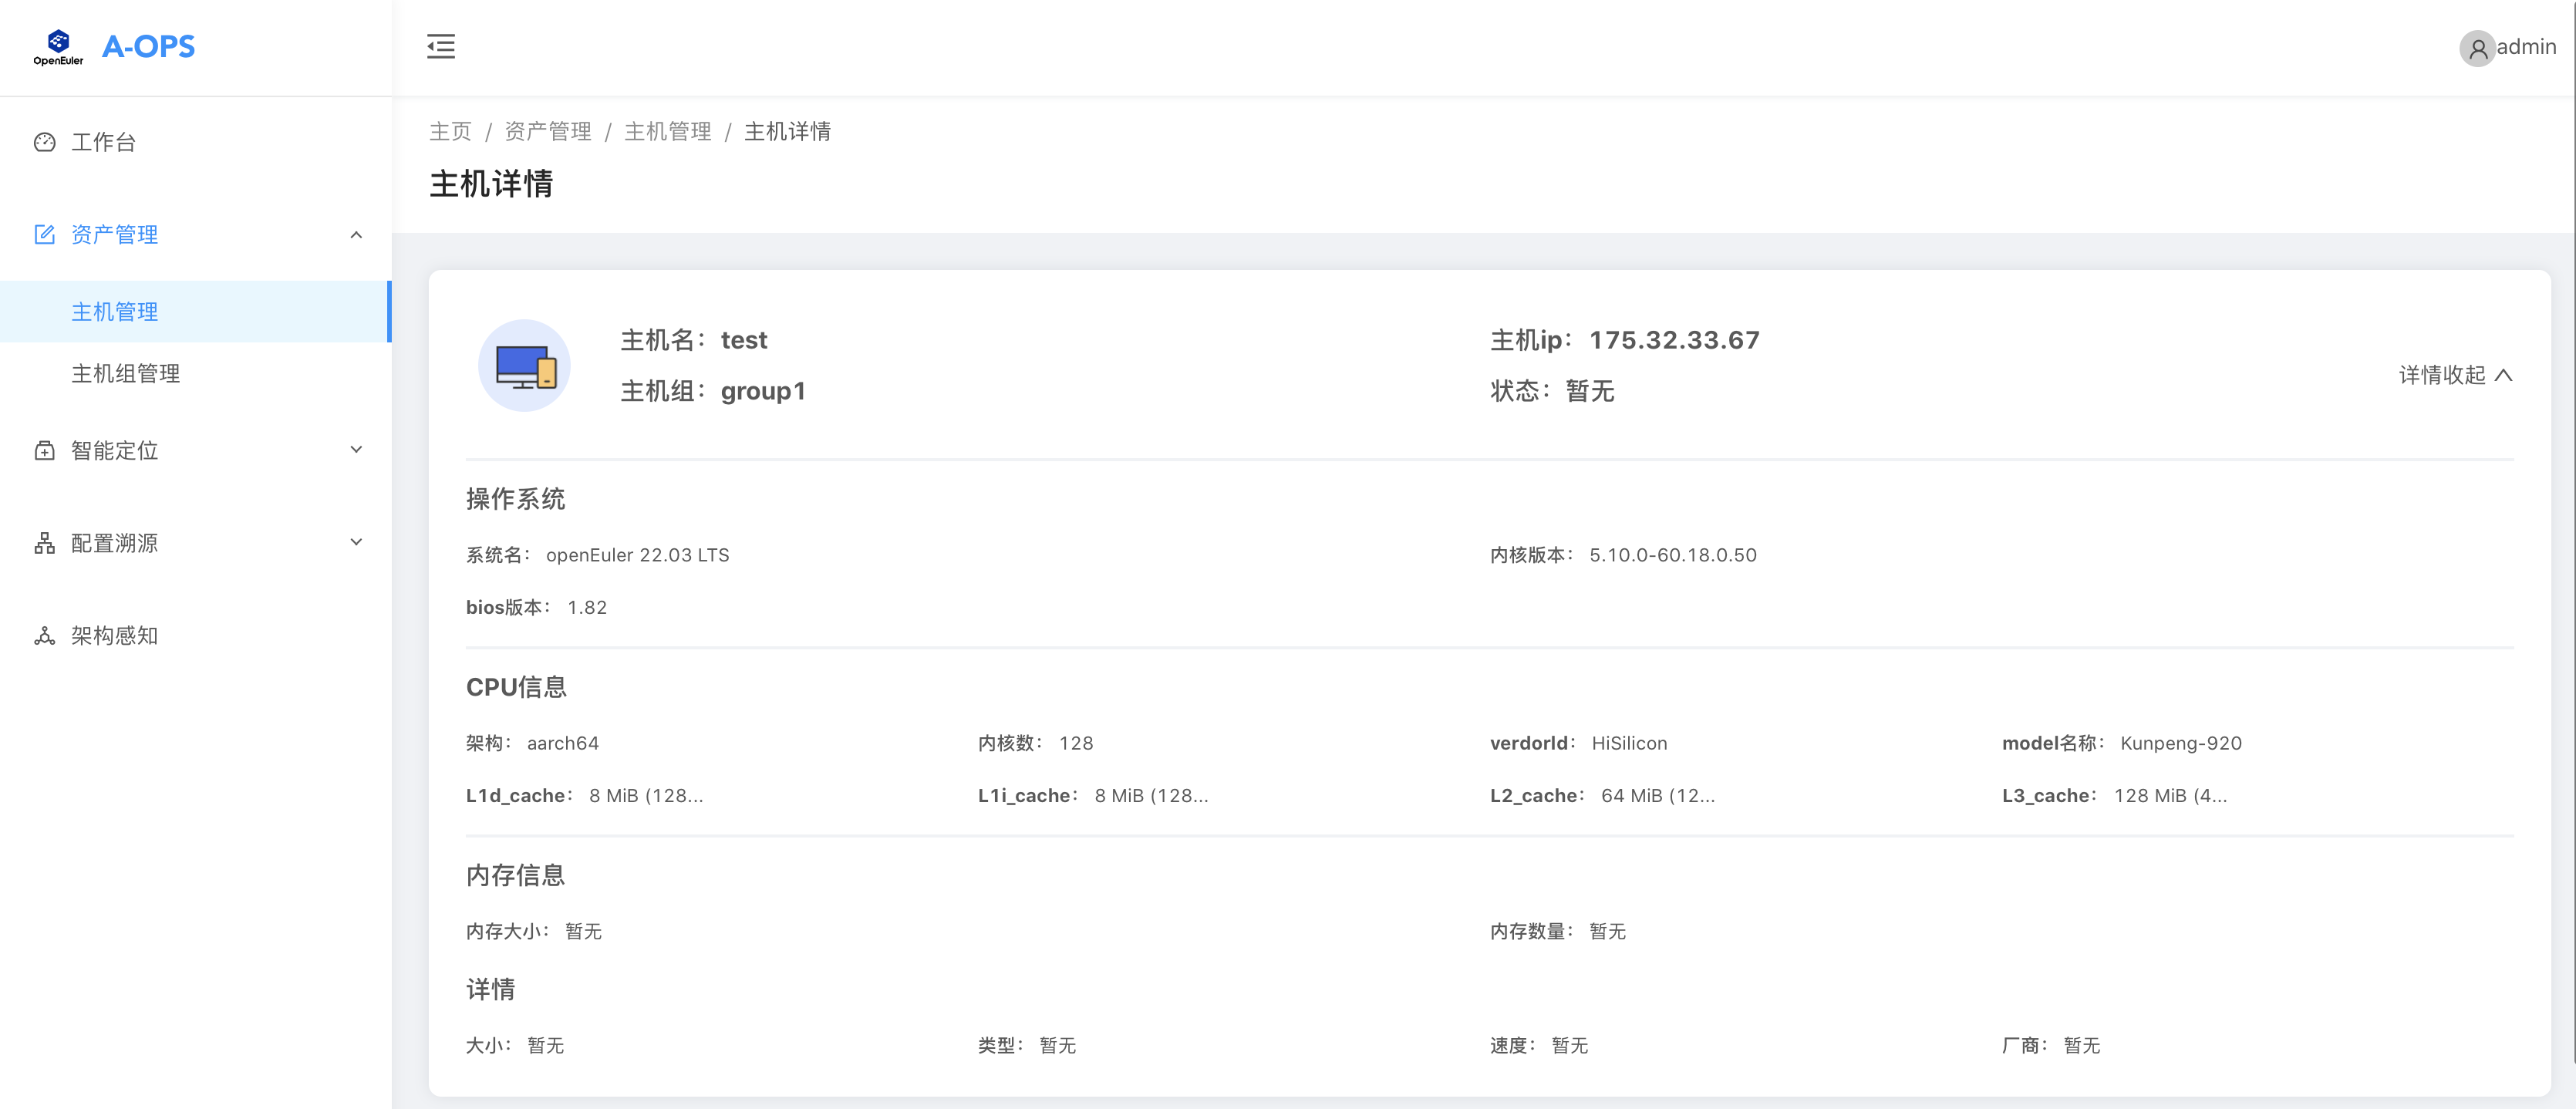
The upper part of the details page displays the basic information about the host, such as the OS and CPU.
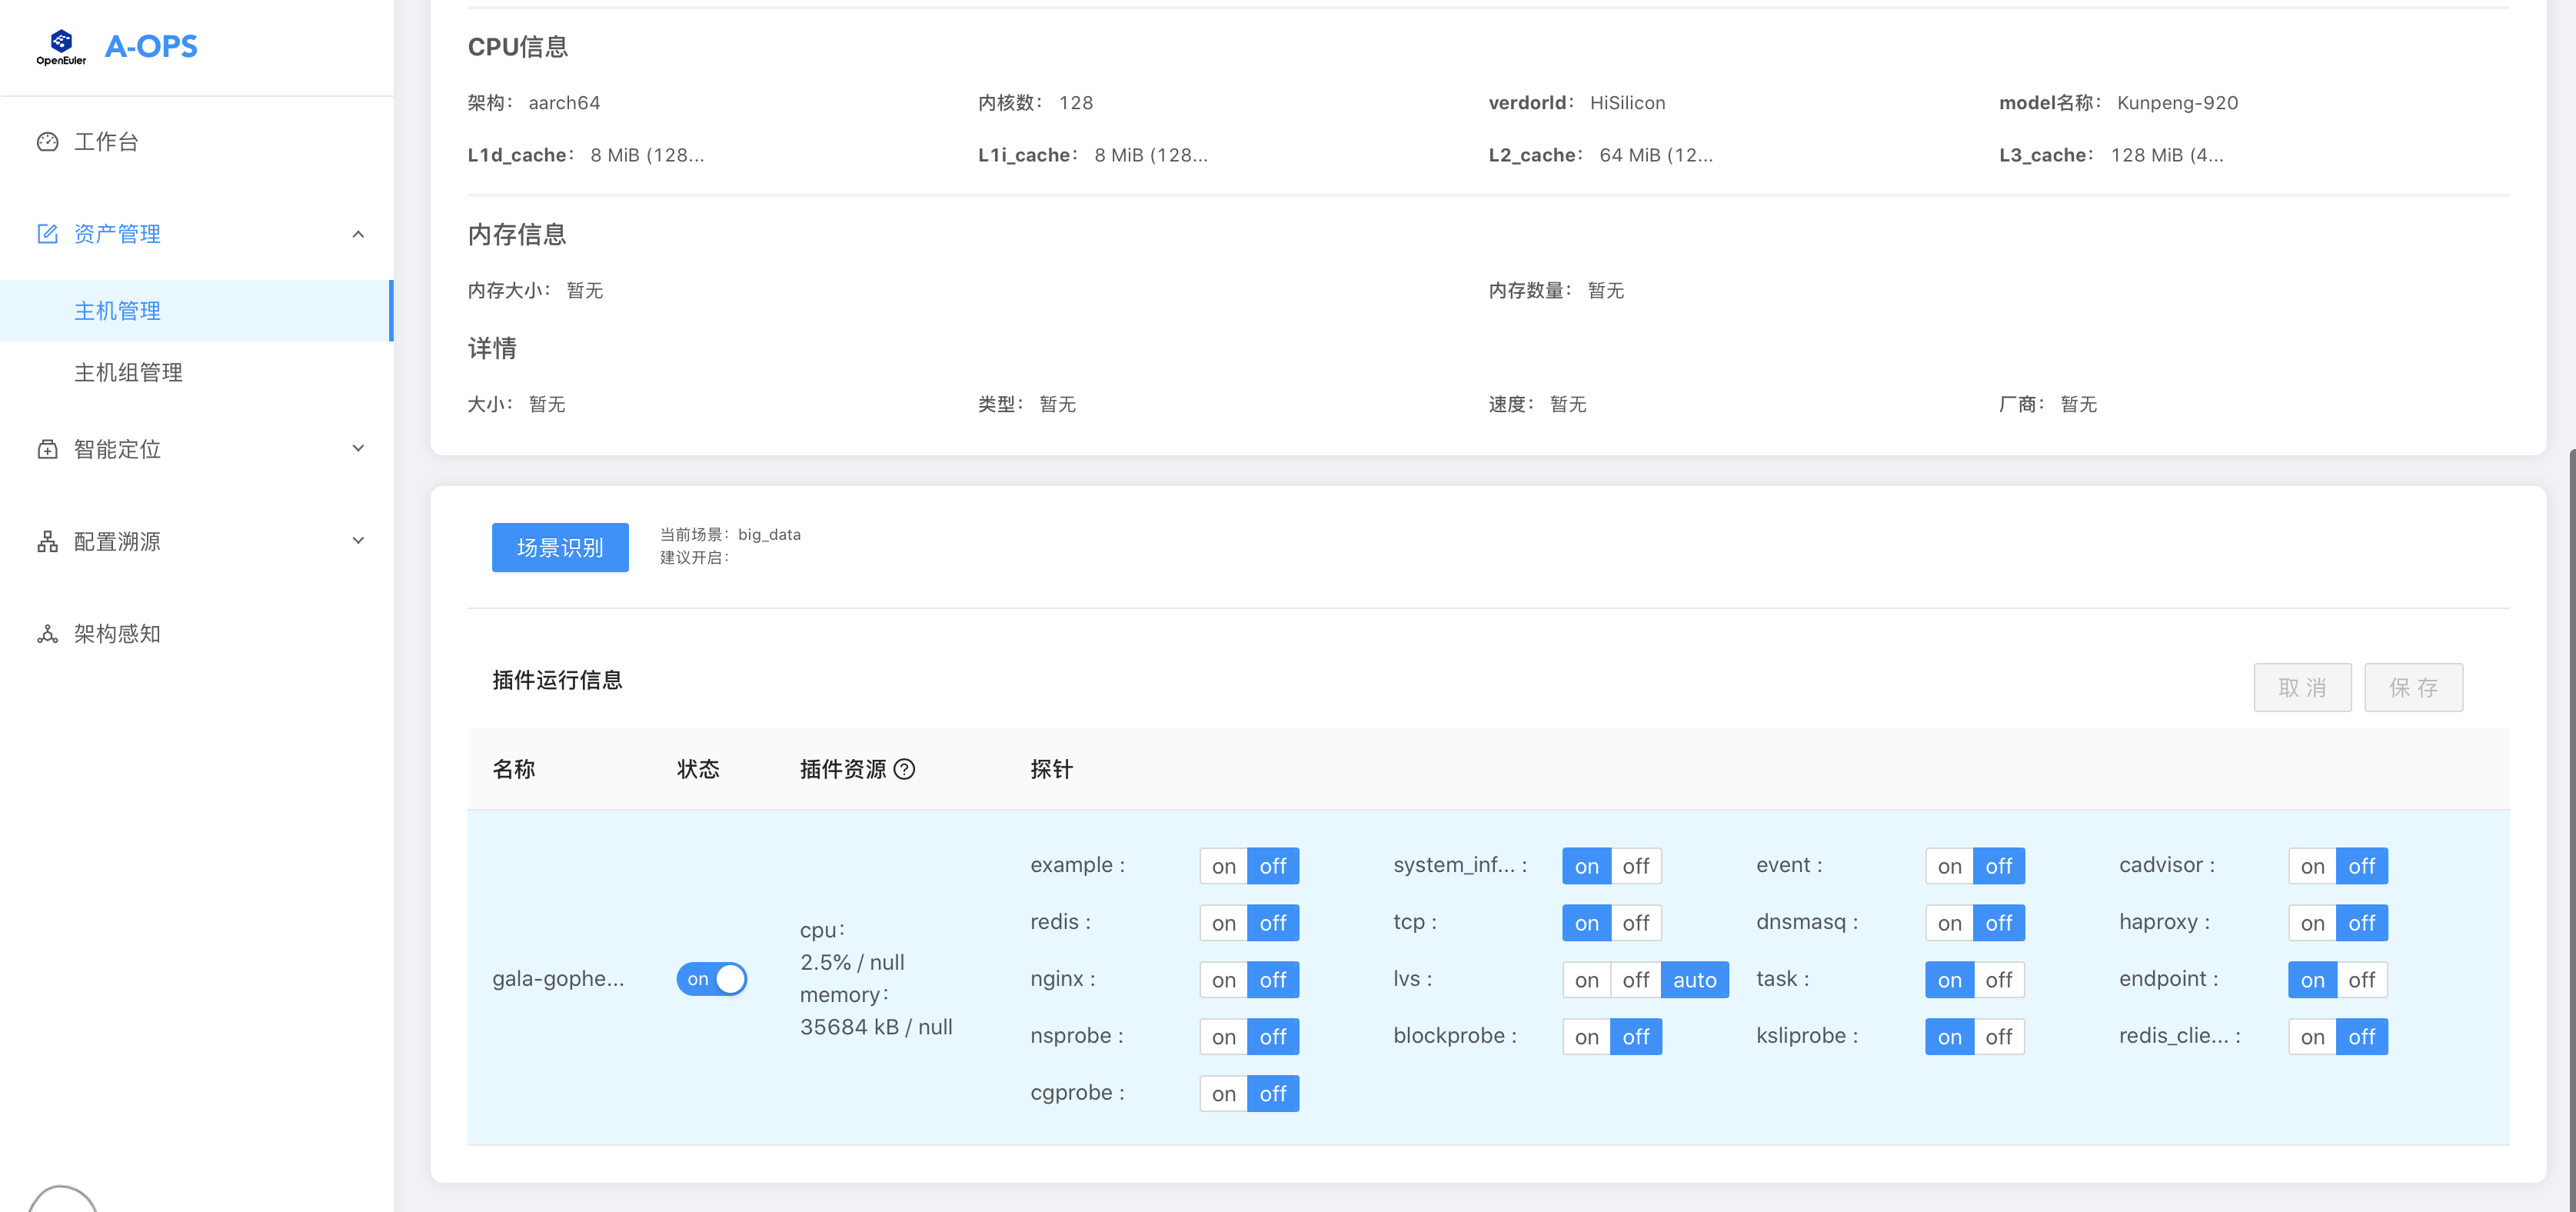
In the lower part of the details page, you can see the information about the collection plugins running on the host (currently, the agent supports only the gala-gopher plugin).
The following operations are supported:
Viewing basic host information and plugin information
Managing plugins (gala-gopher)
- Viewing plugin resources
- Enabling and managing plugins
- Enabling and disabling collection probes of gala-gopher
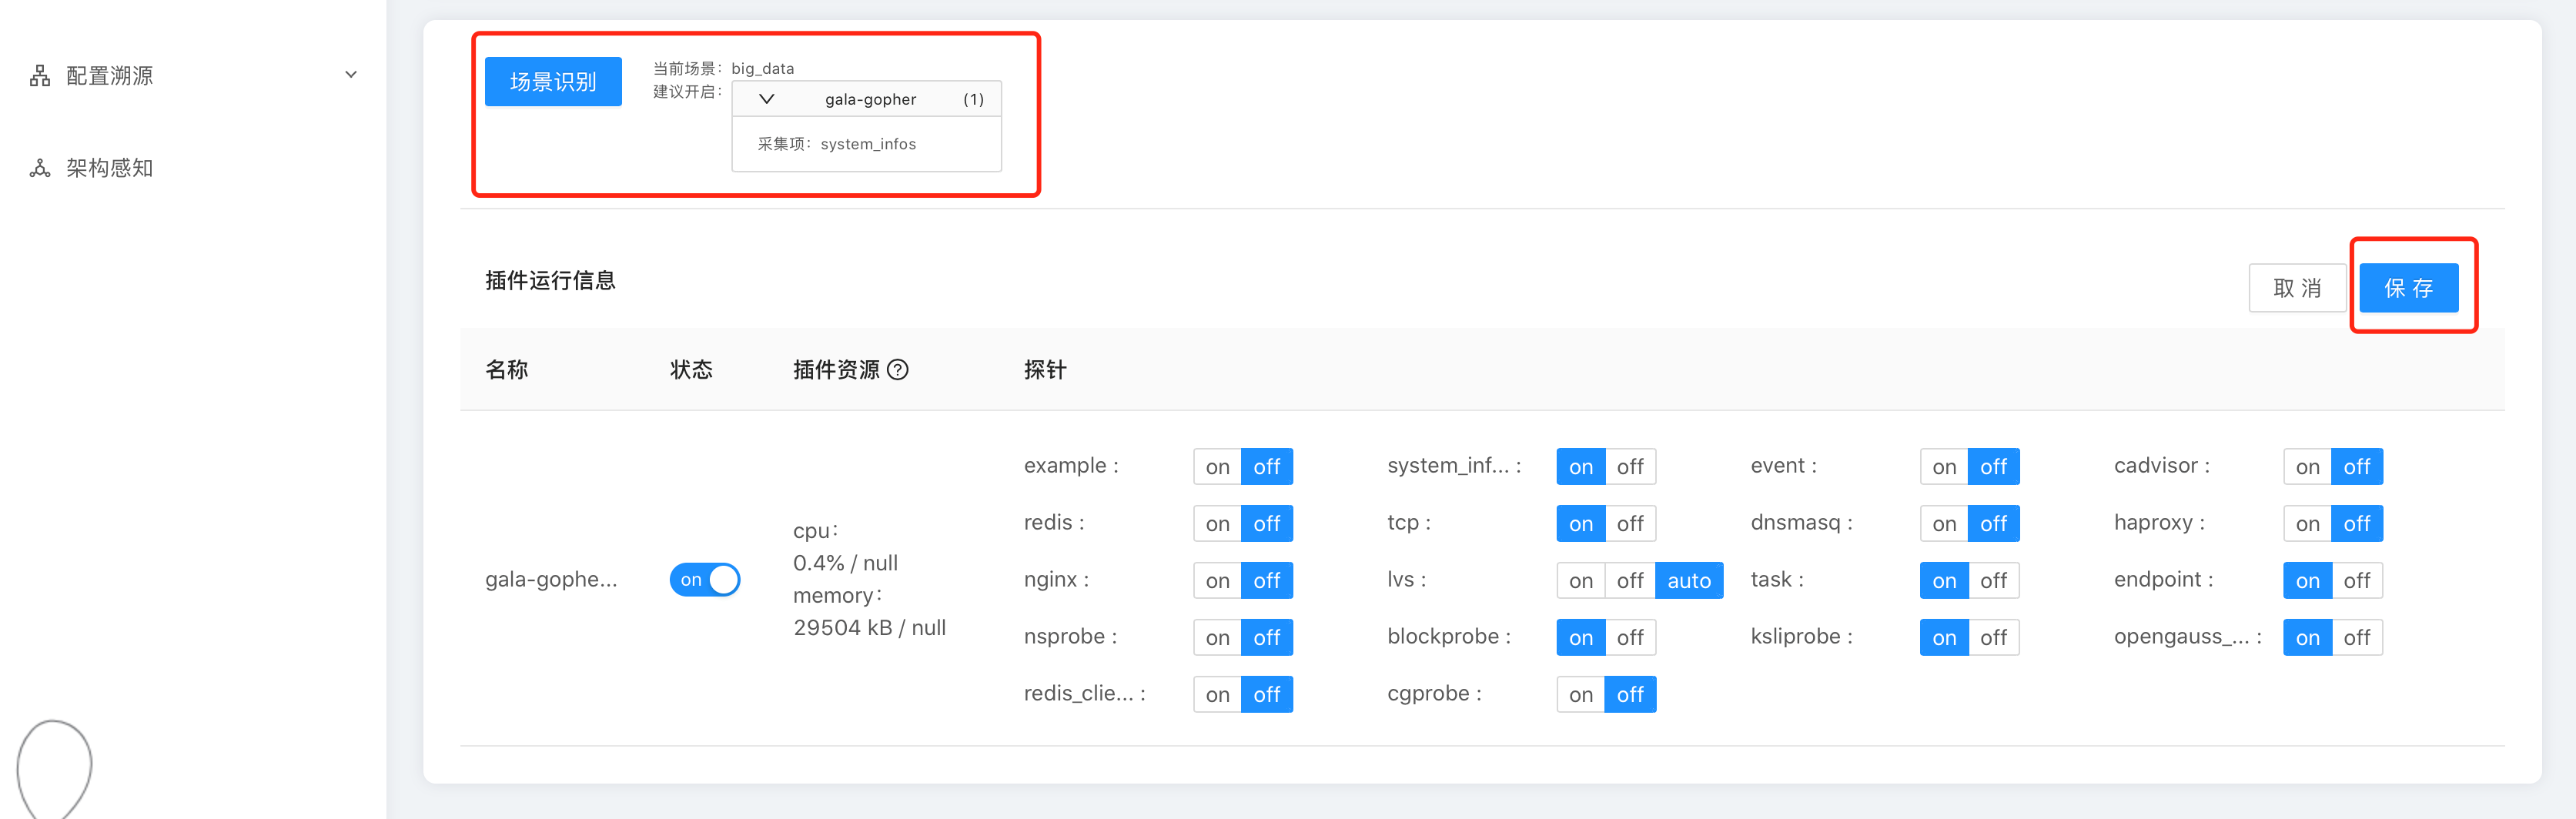
Identifying the host scenario
After you click scenario identification, the system generates the scenario of the host and recommends the plugins and collection items to be enabled for detecting the scenario. You can adjust plugins and probes based on the recommendation result.
Note: After modifying plugin information, for example, disabling a plugin or switching a probe, you must click Save for the modification to take effect.
Intelligent Positioning
The intelligent positioning policy of the AOps project uses the built-in network diagnosis application as a template to generate a personalized workflow for detection and diagnosis.
As a workflow template, an application describes the connection between the steps in detection and the recommendation logic of the detection model used in each step. When generating a workflow, you can customize the details of the workflow based on the collection items, scenarios, and other information of each host.
(1) Workflow List page:
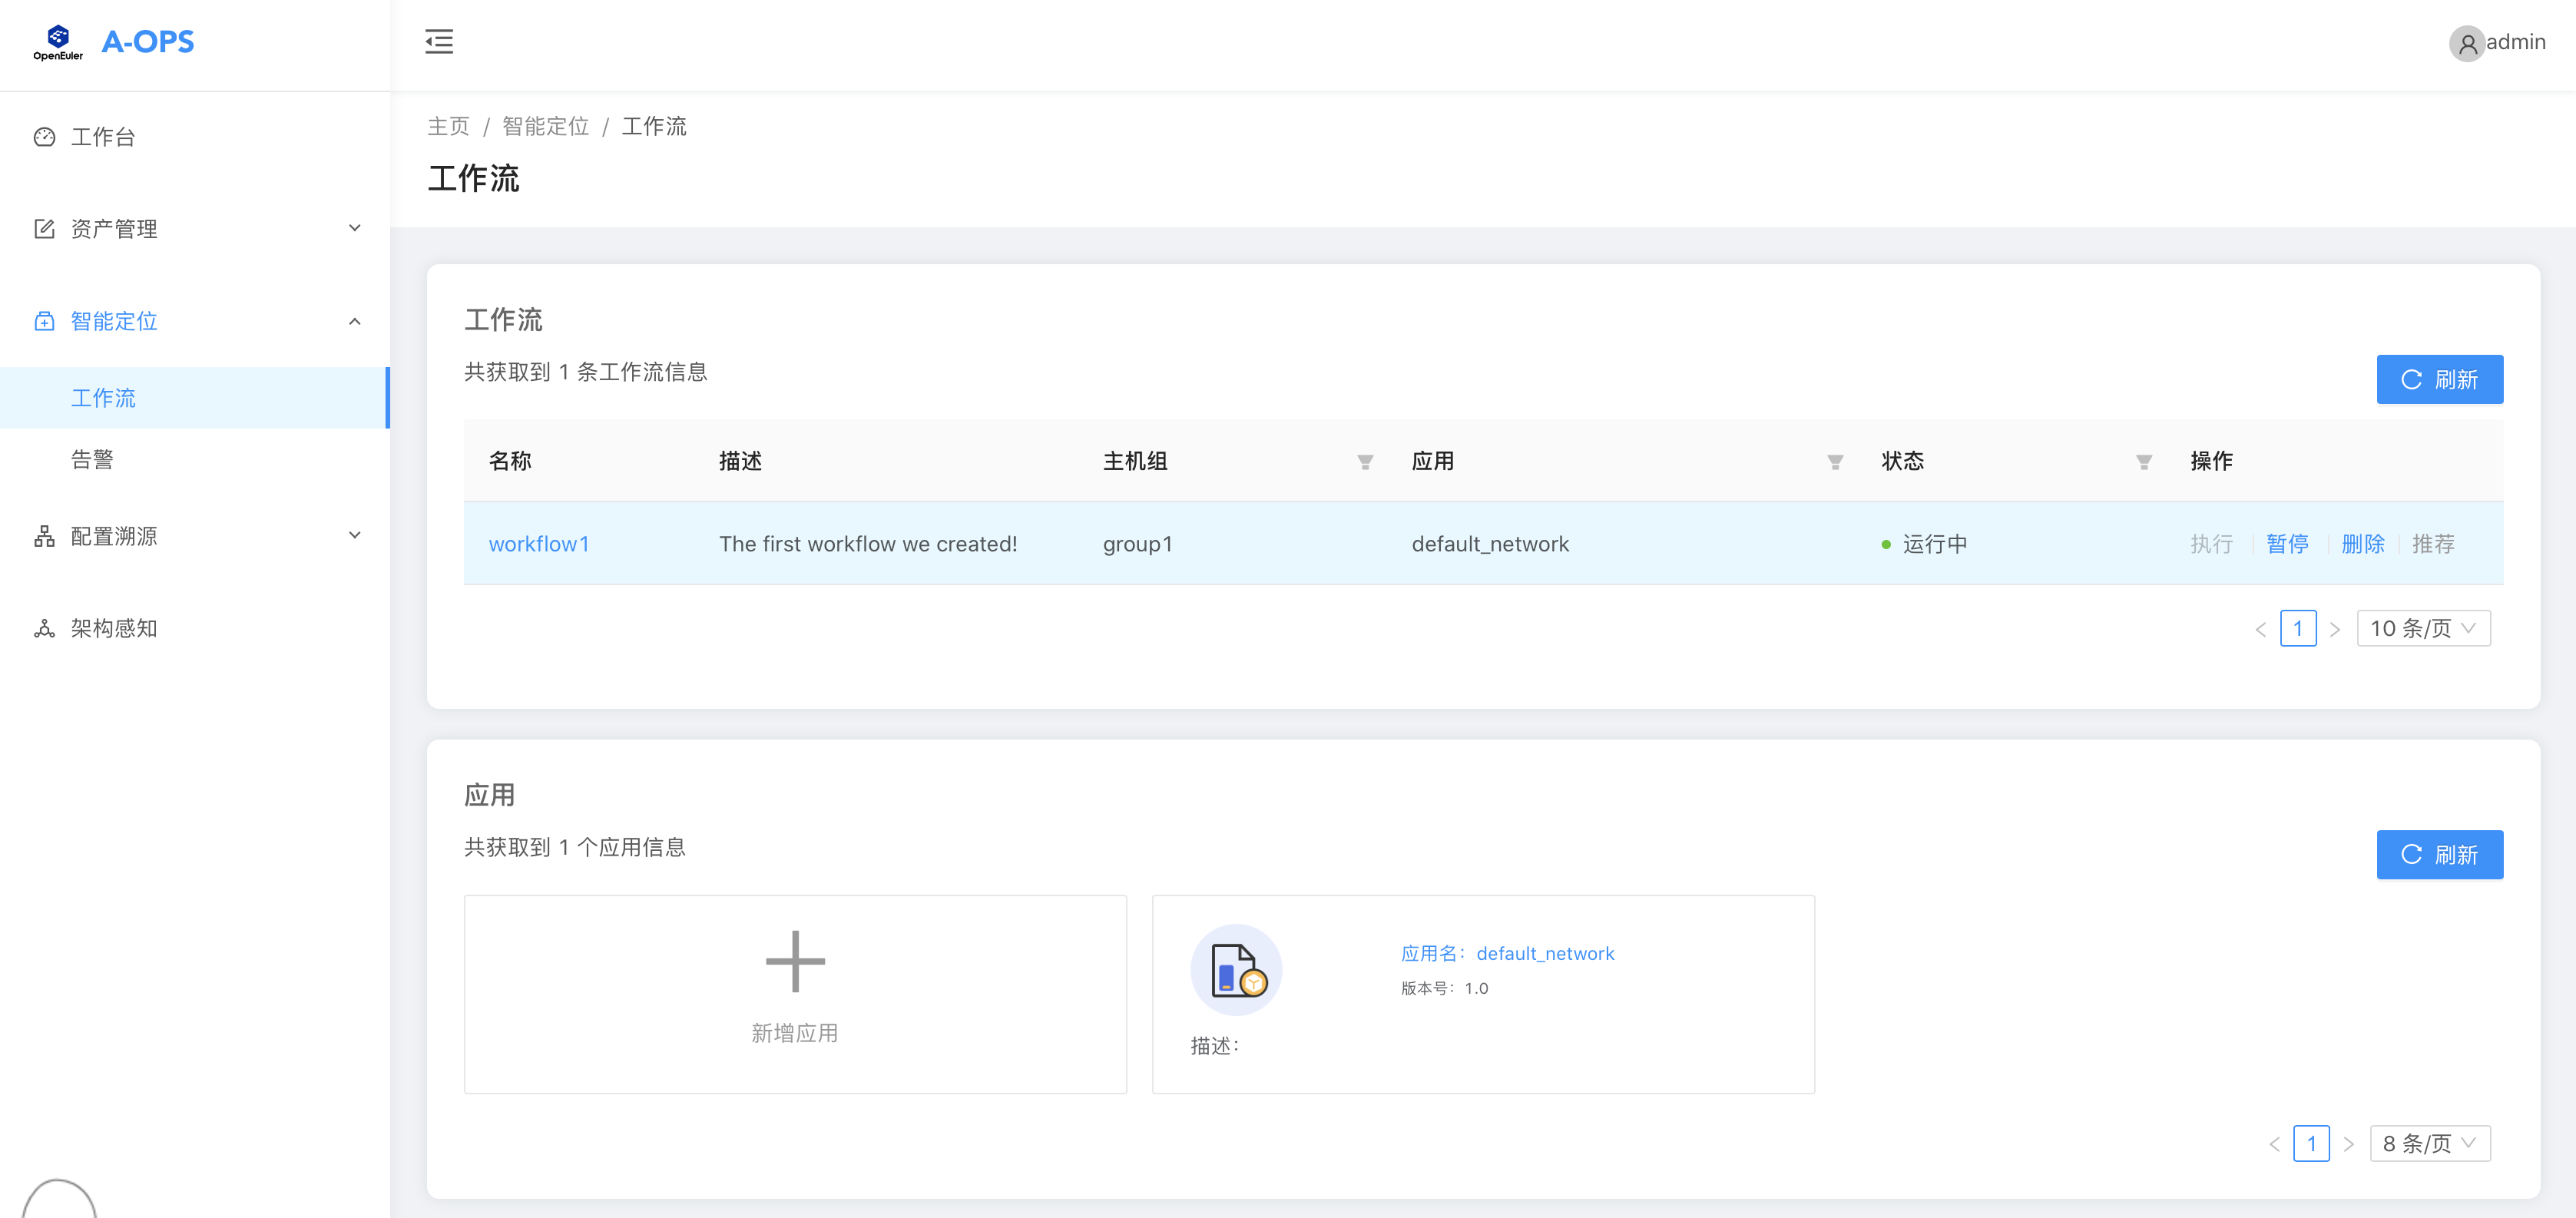
Supported operations:
- Viewing the current workflow list. You can filter workflows by host group, application, and status, and perform pagination.
- Viewing the current application list
(2) Workflow Details page:
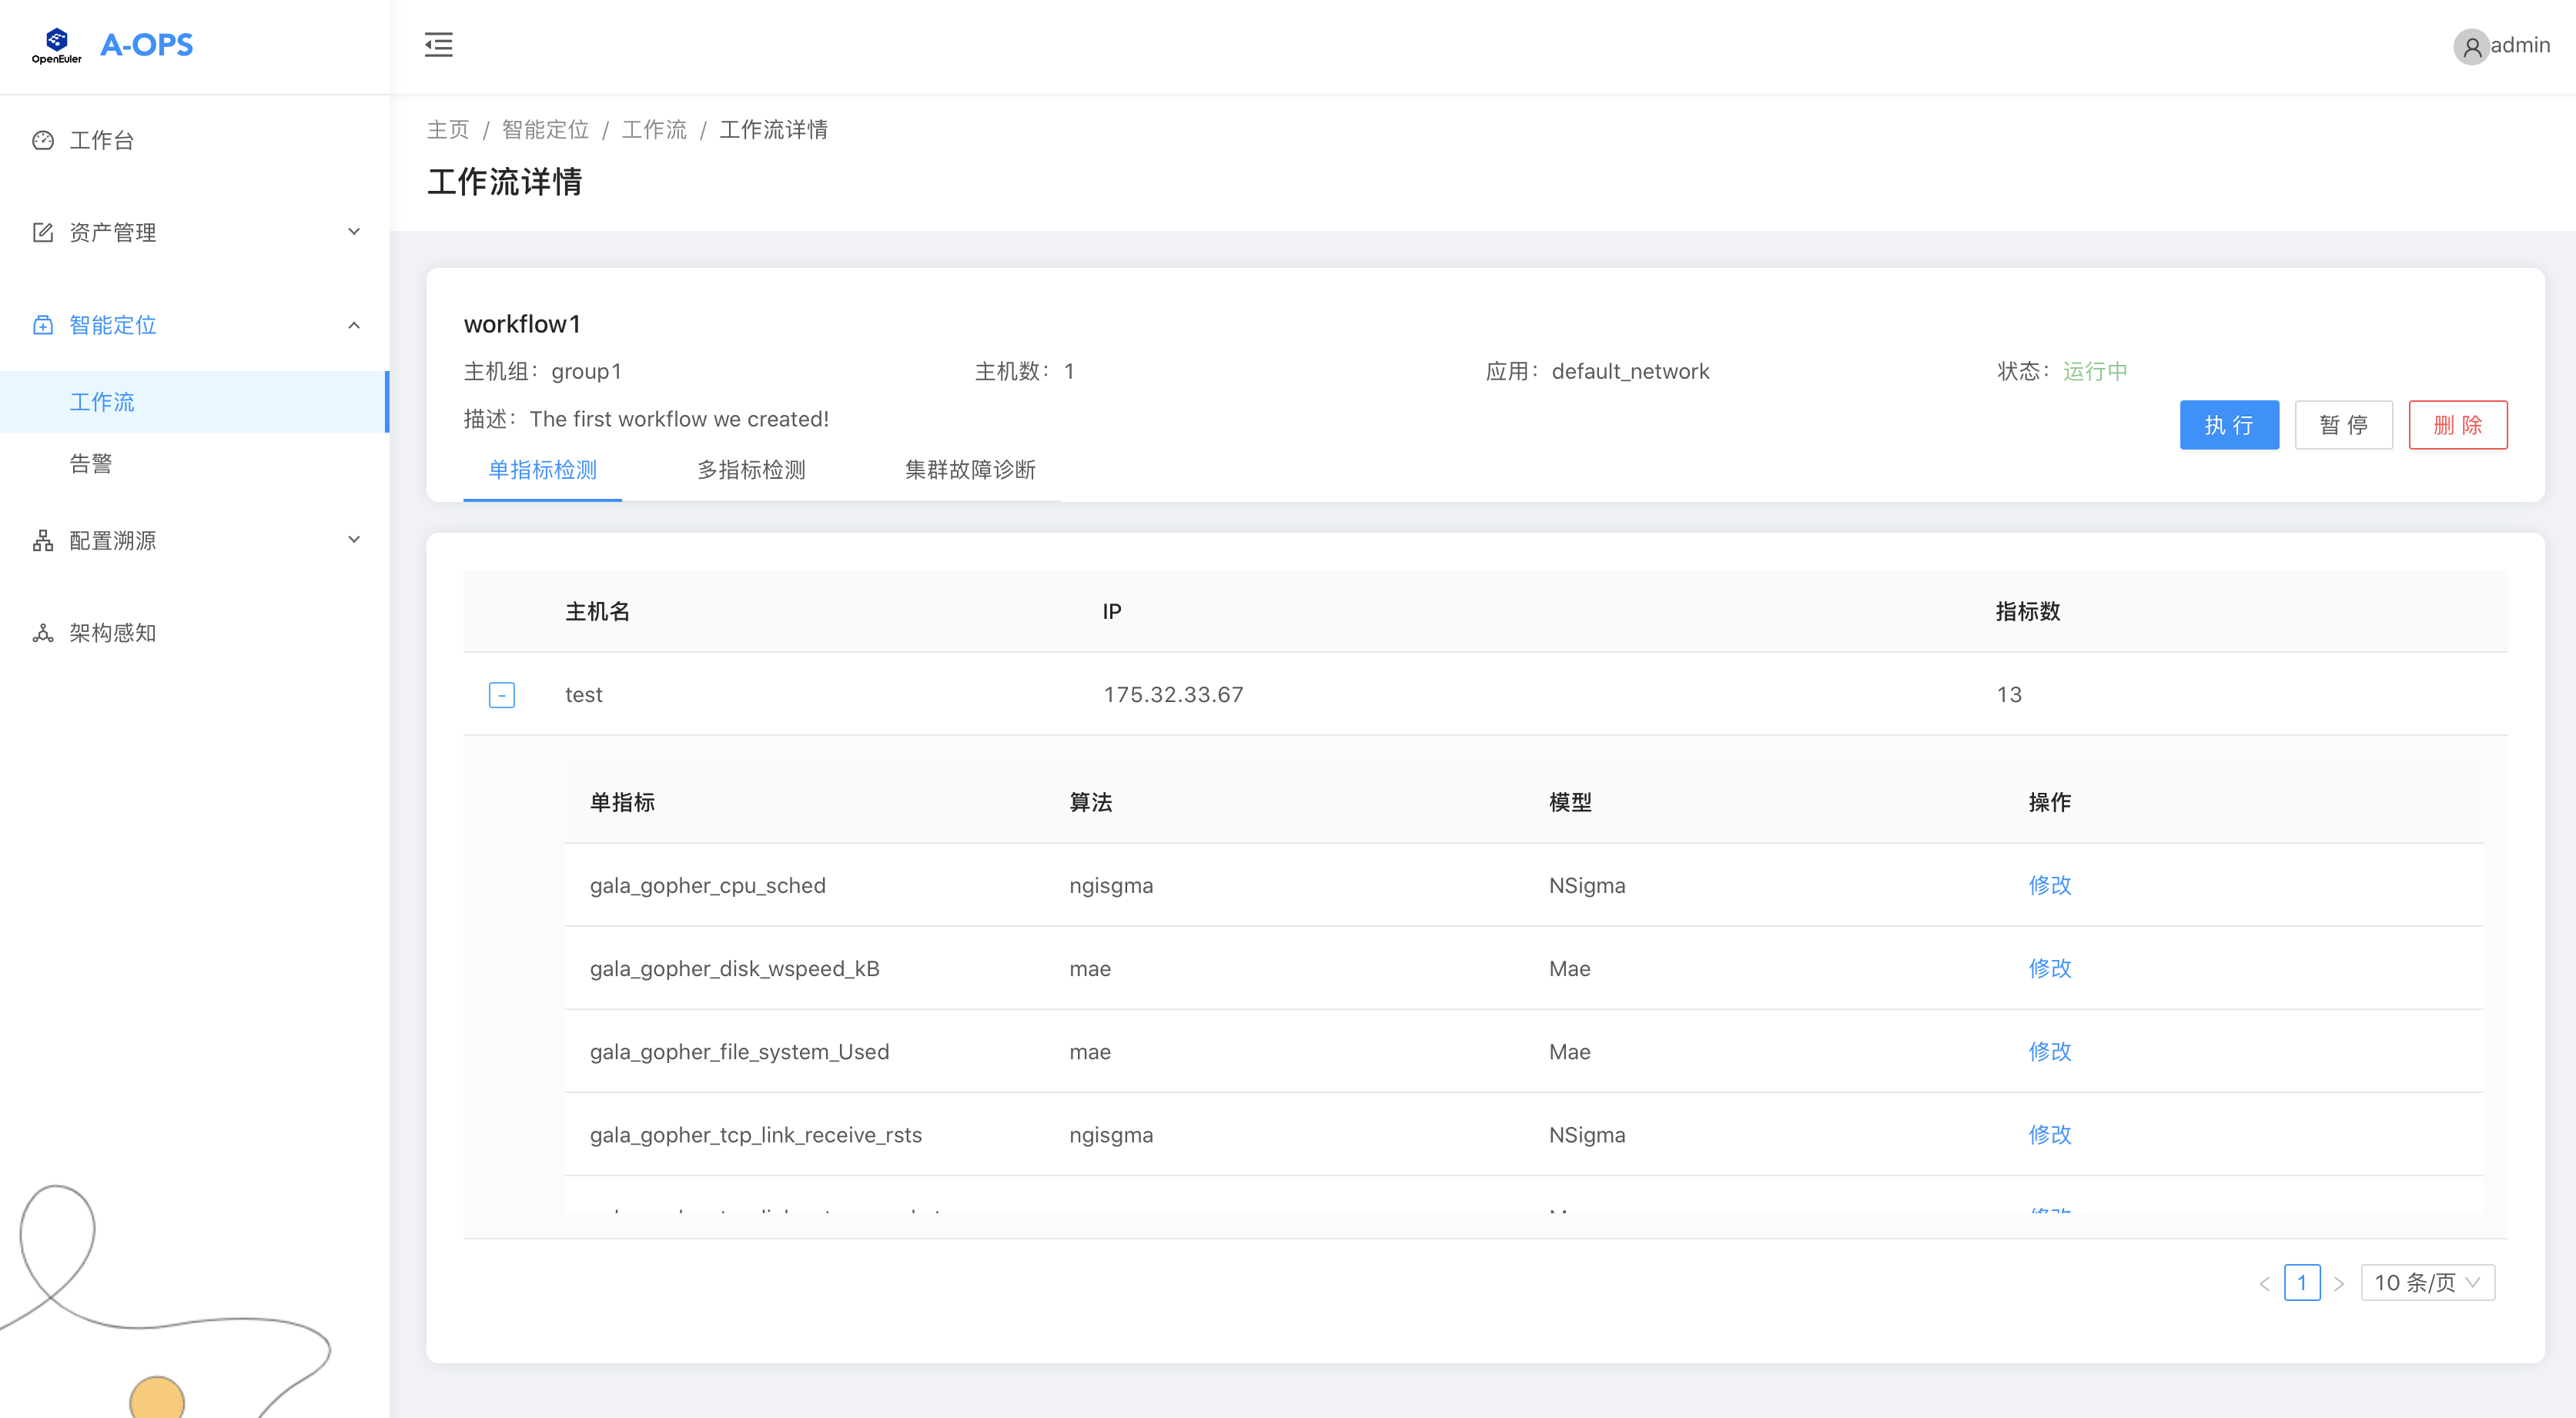
Supported operations:
- Viewing basic information about the host group to which the workflow belongs, the number of hosts, and the status
- Viewing the detailed algorithm model information of each step, including single-indicator detection, multi-indicator detection, and cluster fault diagnosis
- Modifying the model used in each detection step
- Executing, pausing, and deleting a workflow
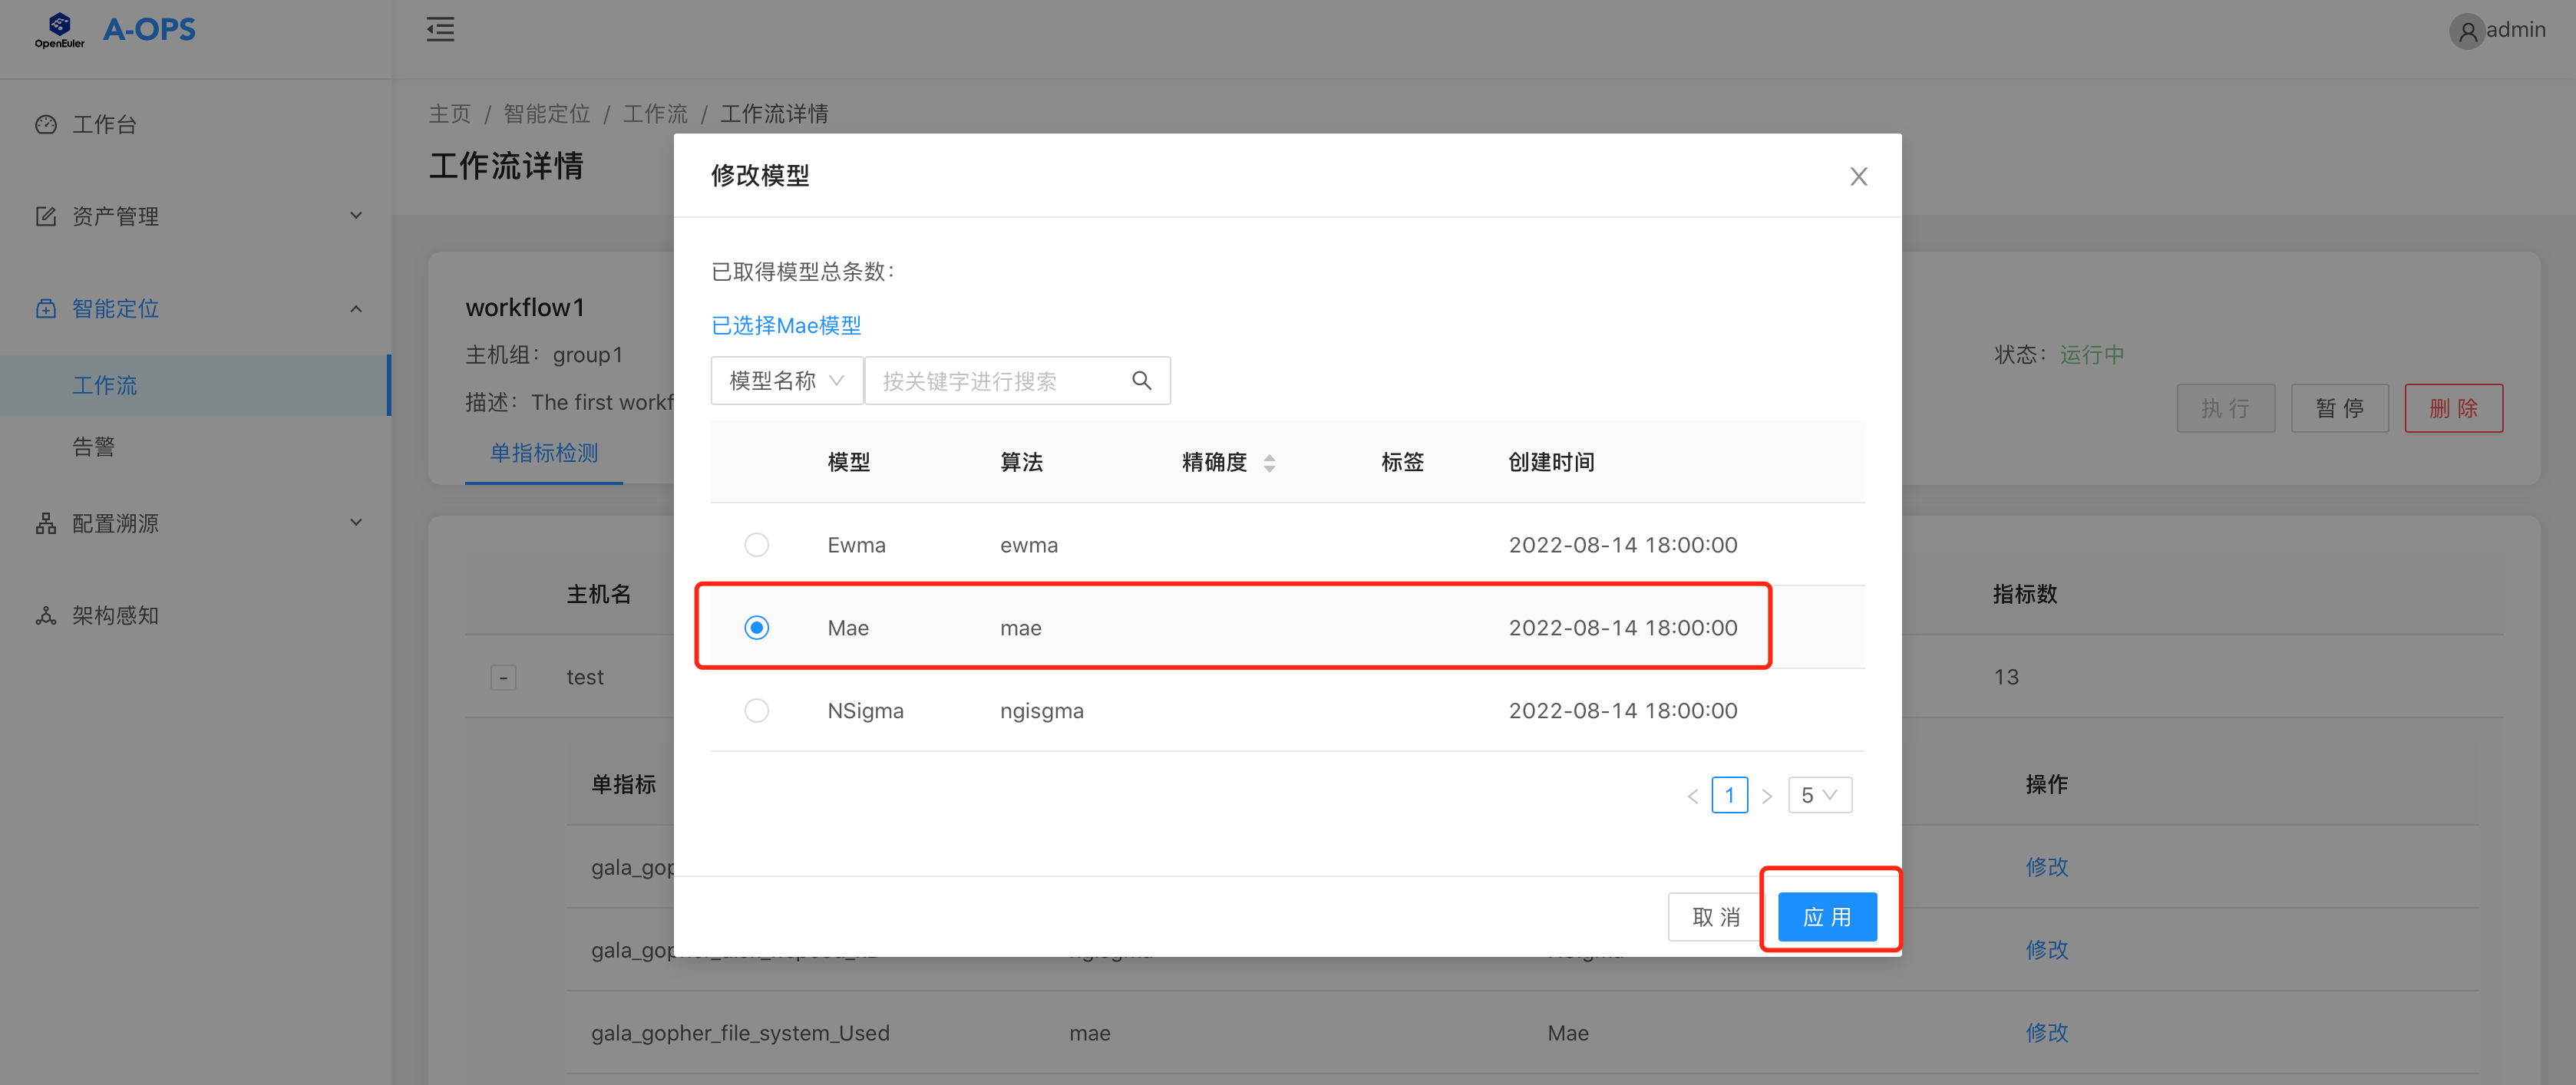
When modifying the model of a detection step, you can search the built-in model library by model name or tag, select a model, and click Apply to change it.
(3) Application Details page:
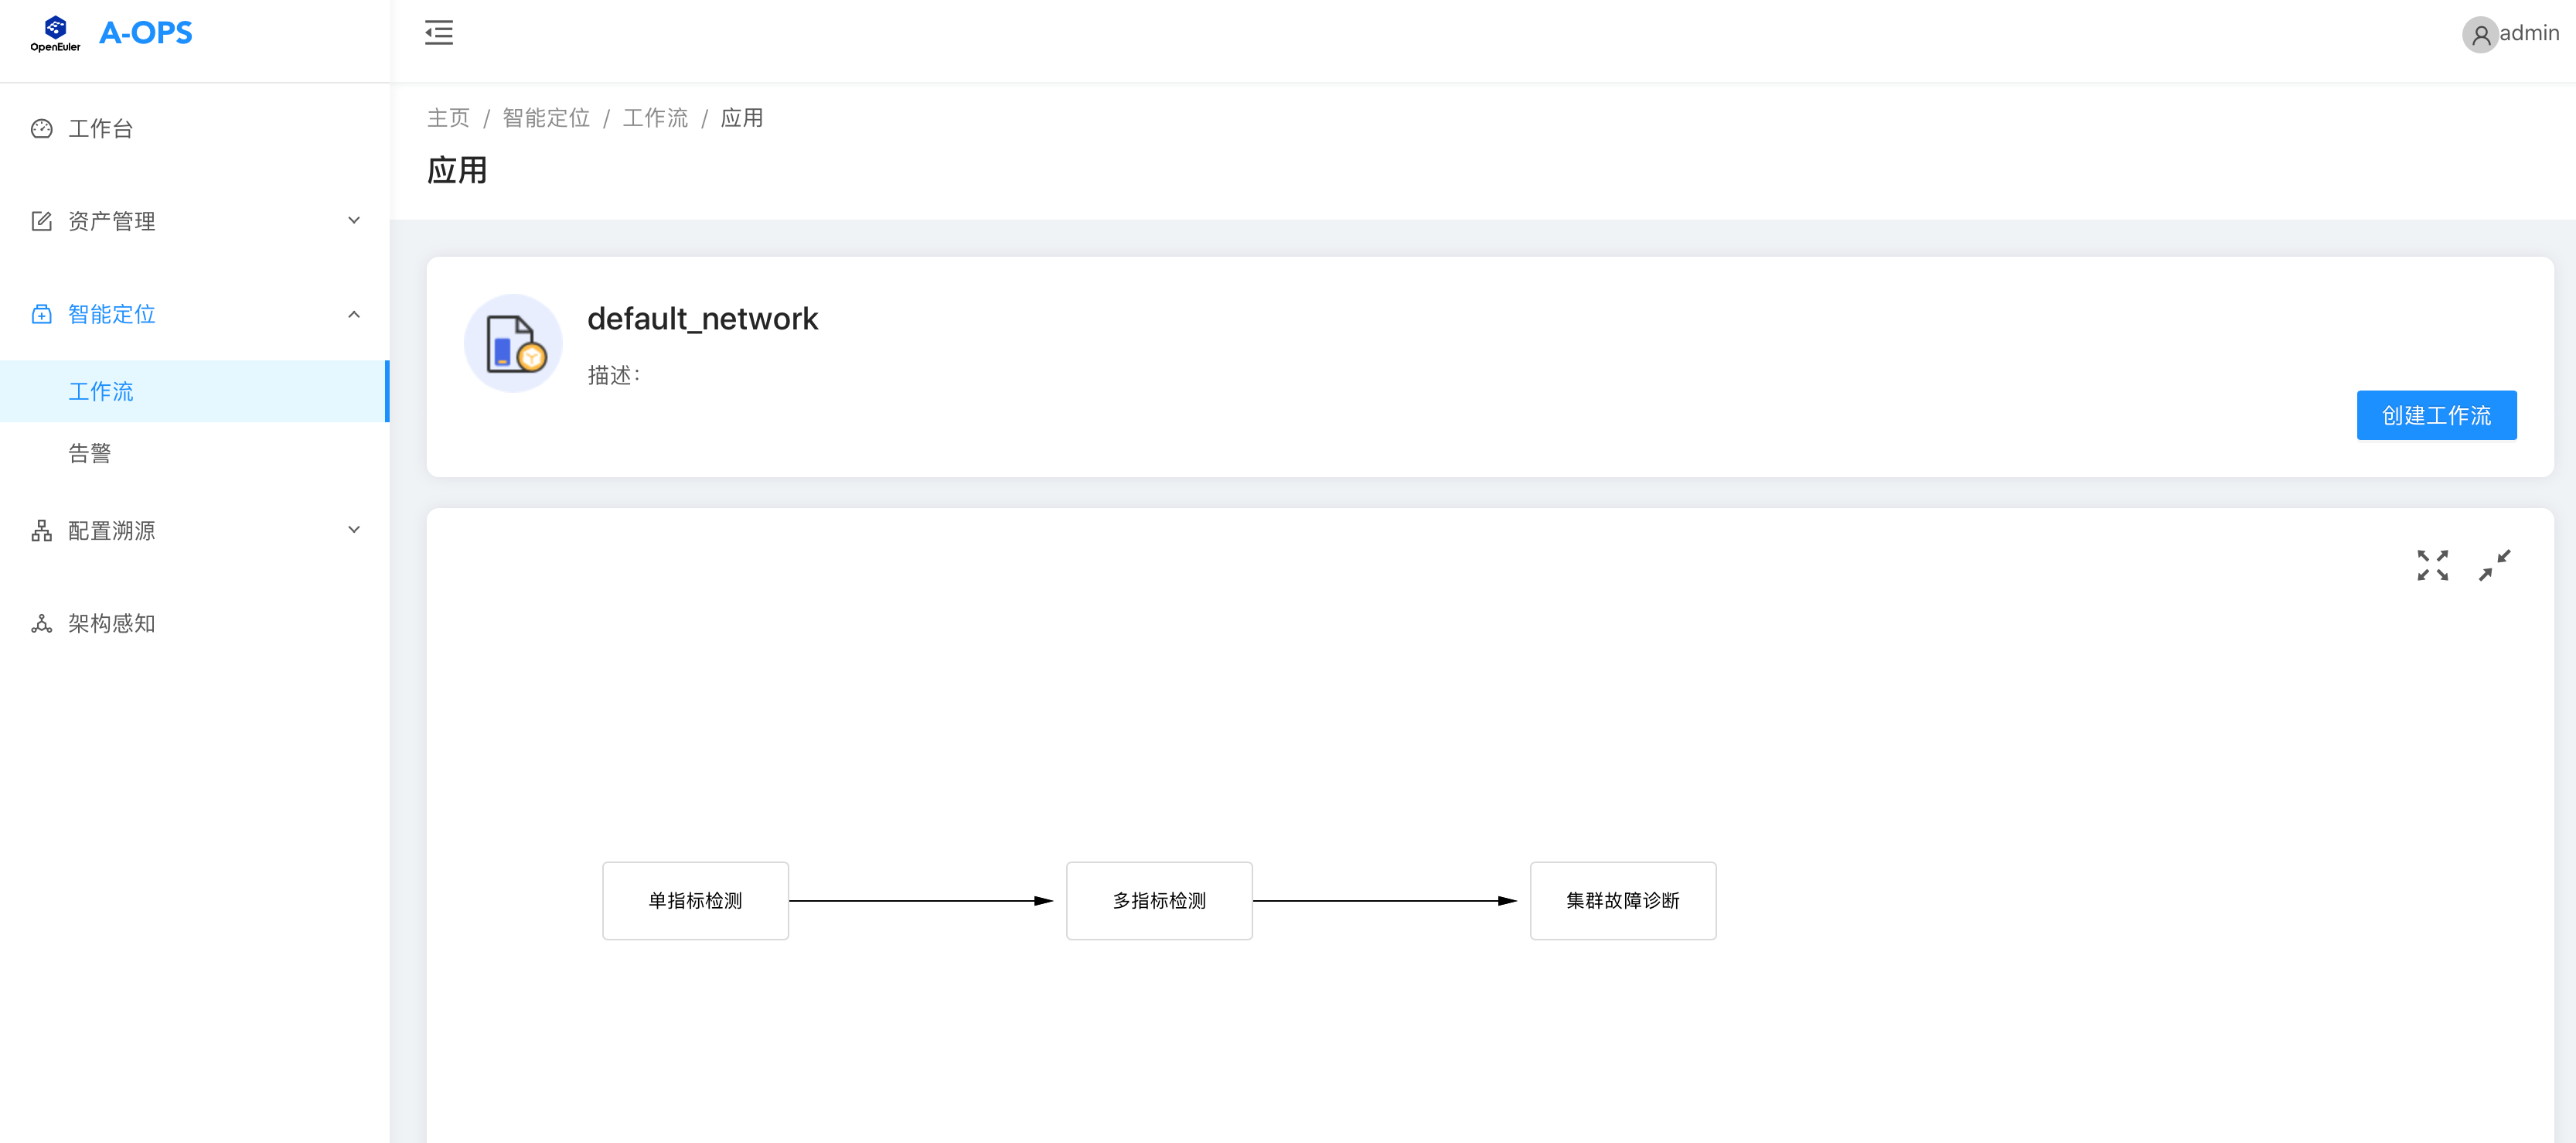
Supported operations:
- Viewing the overall process of the application
- Creating a workflow based on the application
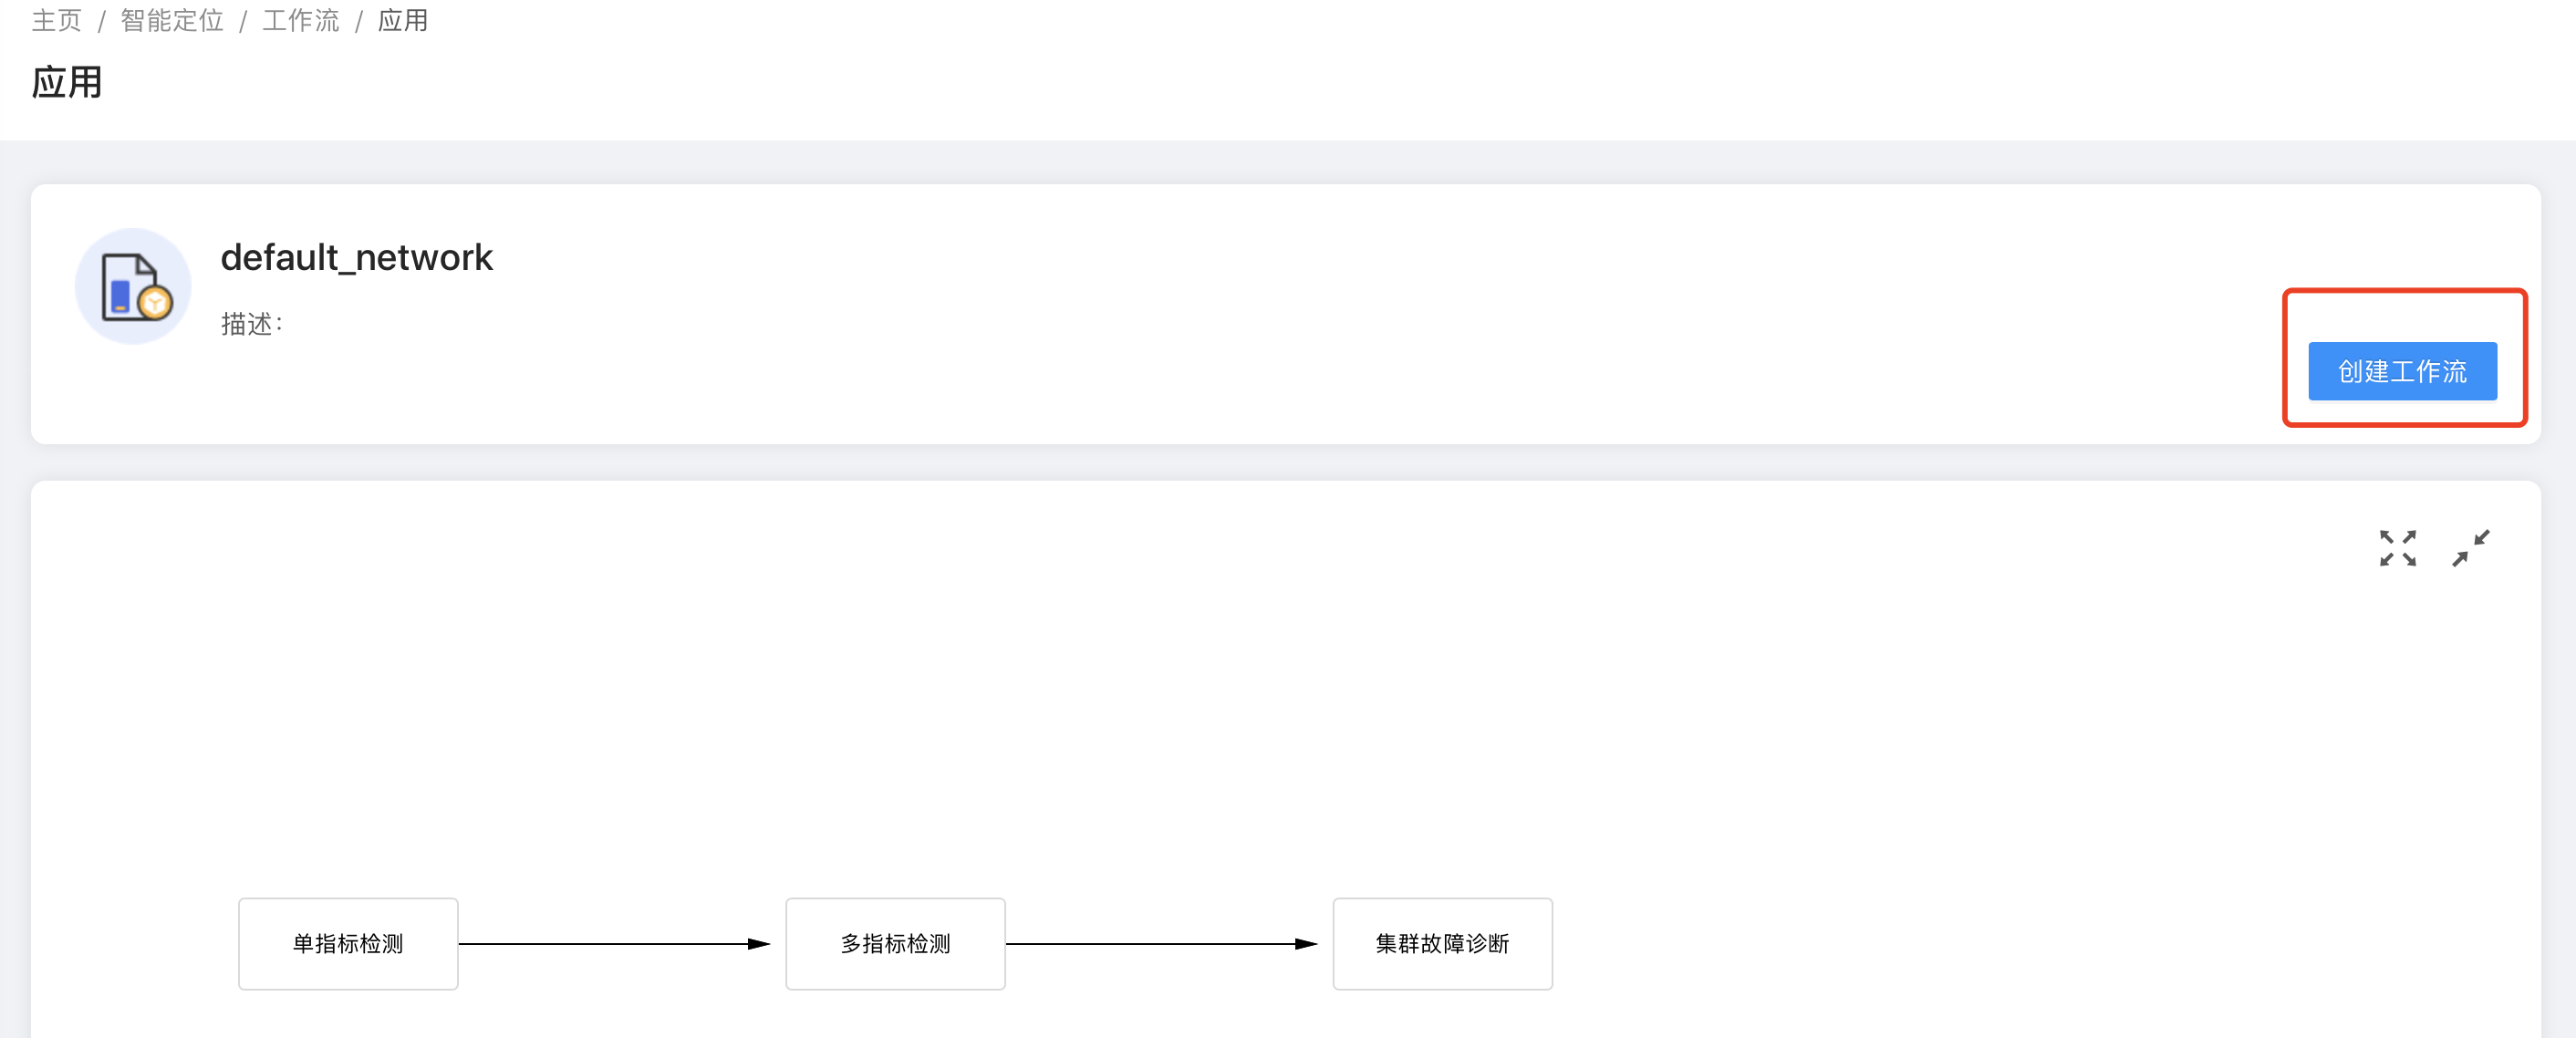
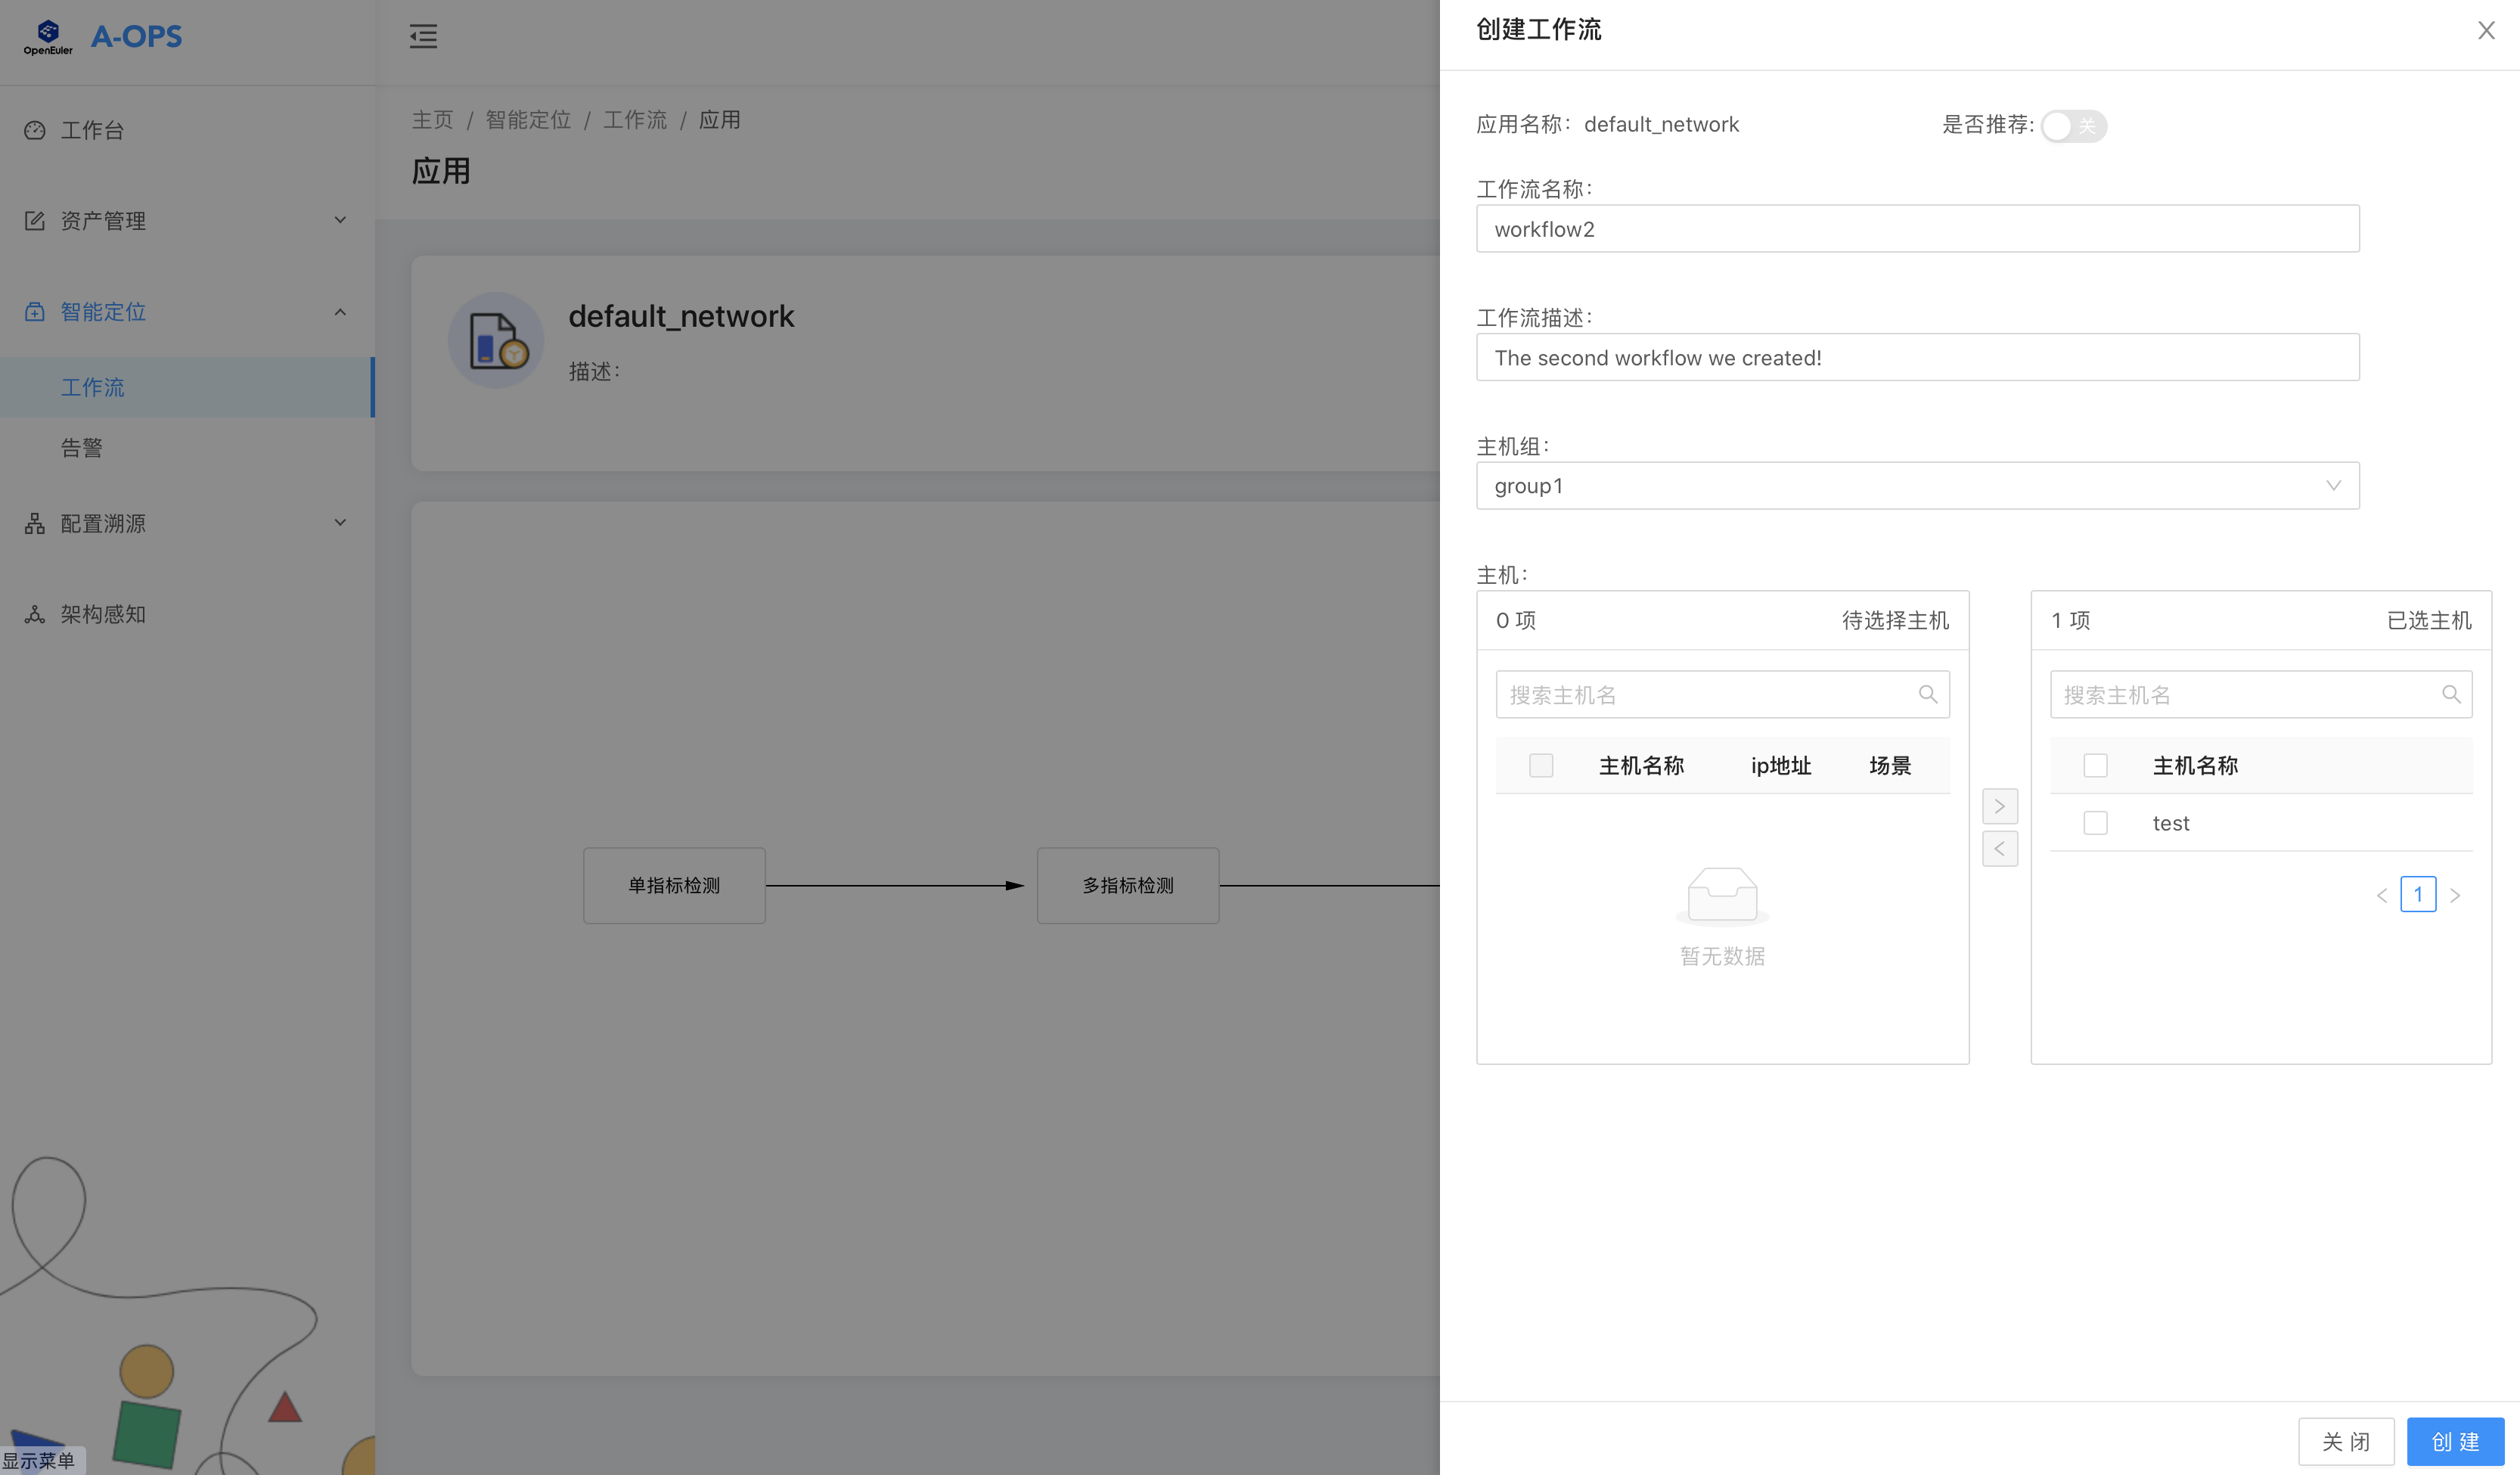
To create a workflow, click the create workflow button in the upper right corner, enter the name and description of the workflow in the window displayed on the right, and select the host group to be detected. After a host group is selected, all hosts in the host group are listed below. You can select some hosts and move them to the list on the right, and then click Create. The new workflow is then displayed in the workflow list.
(4) Alarm
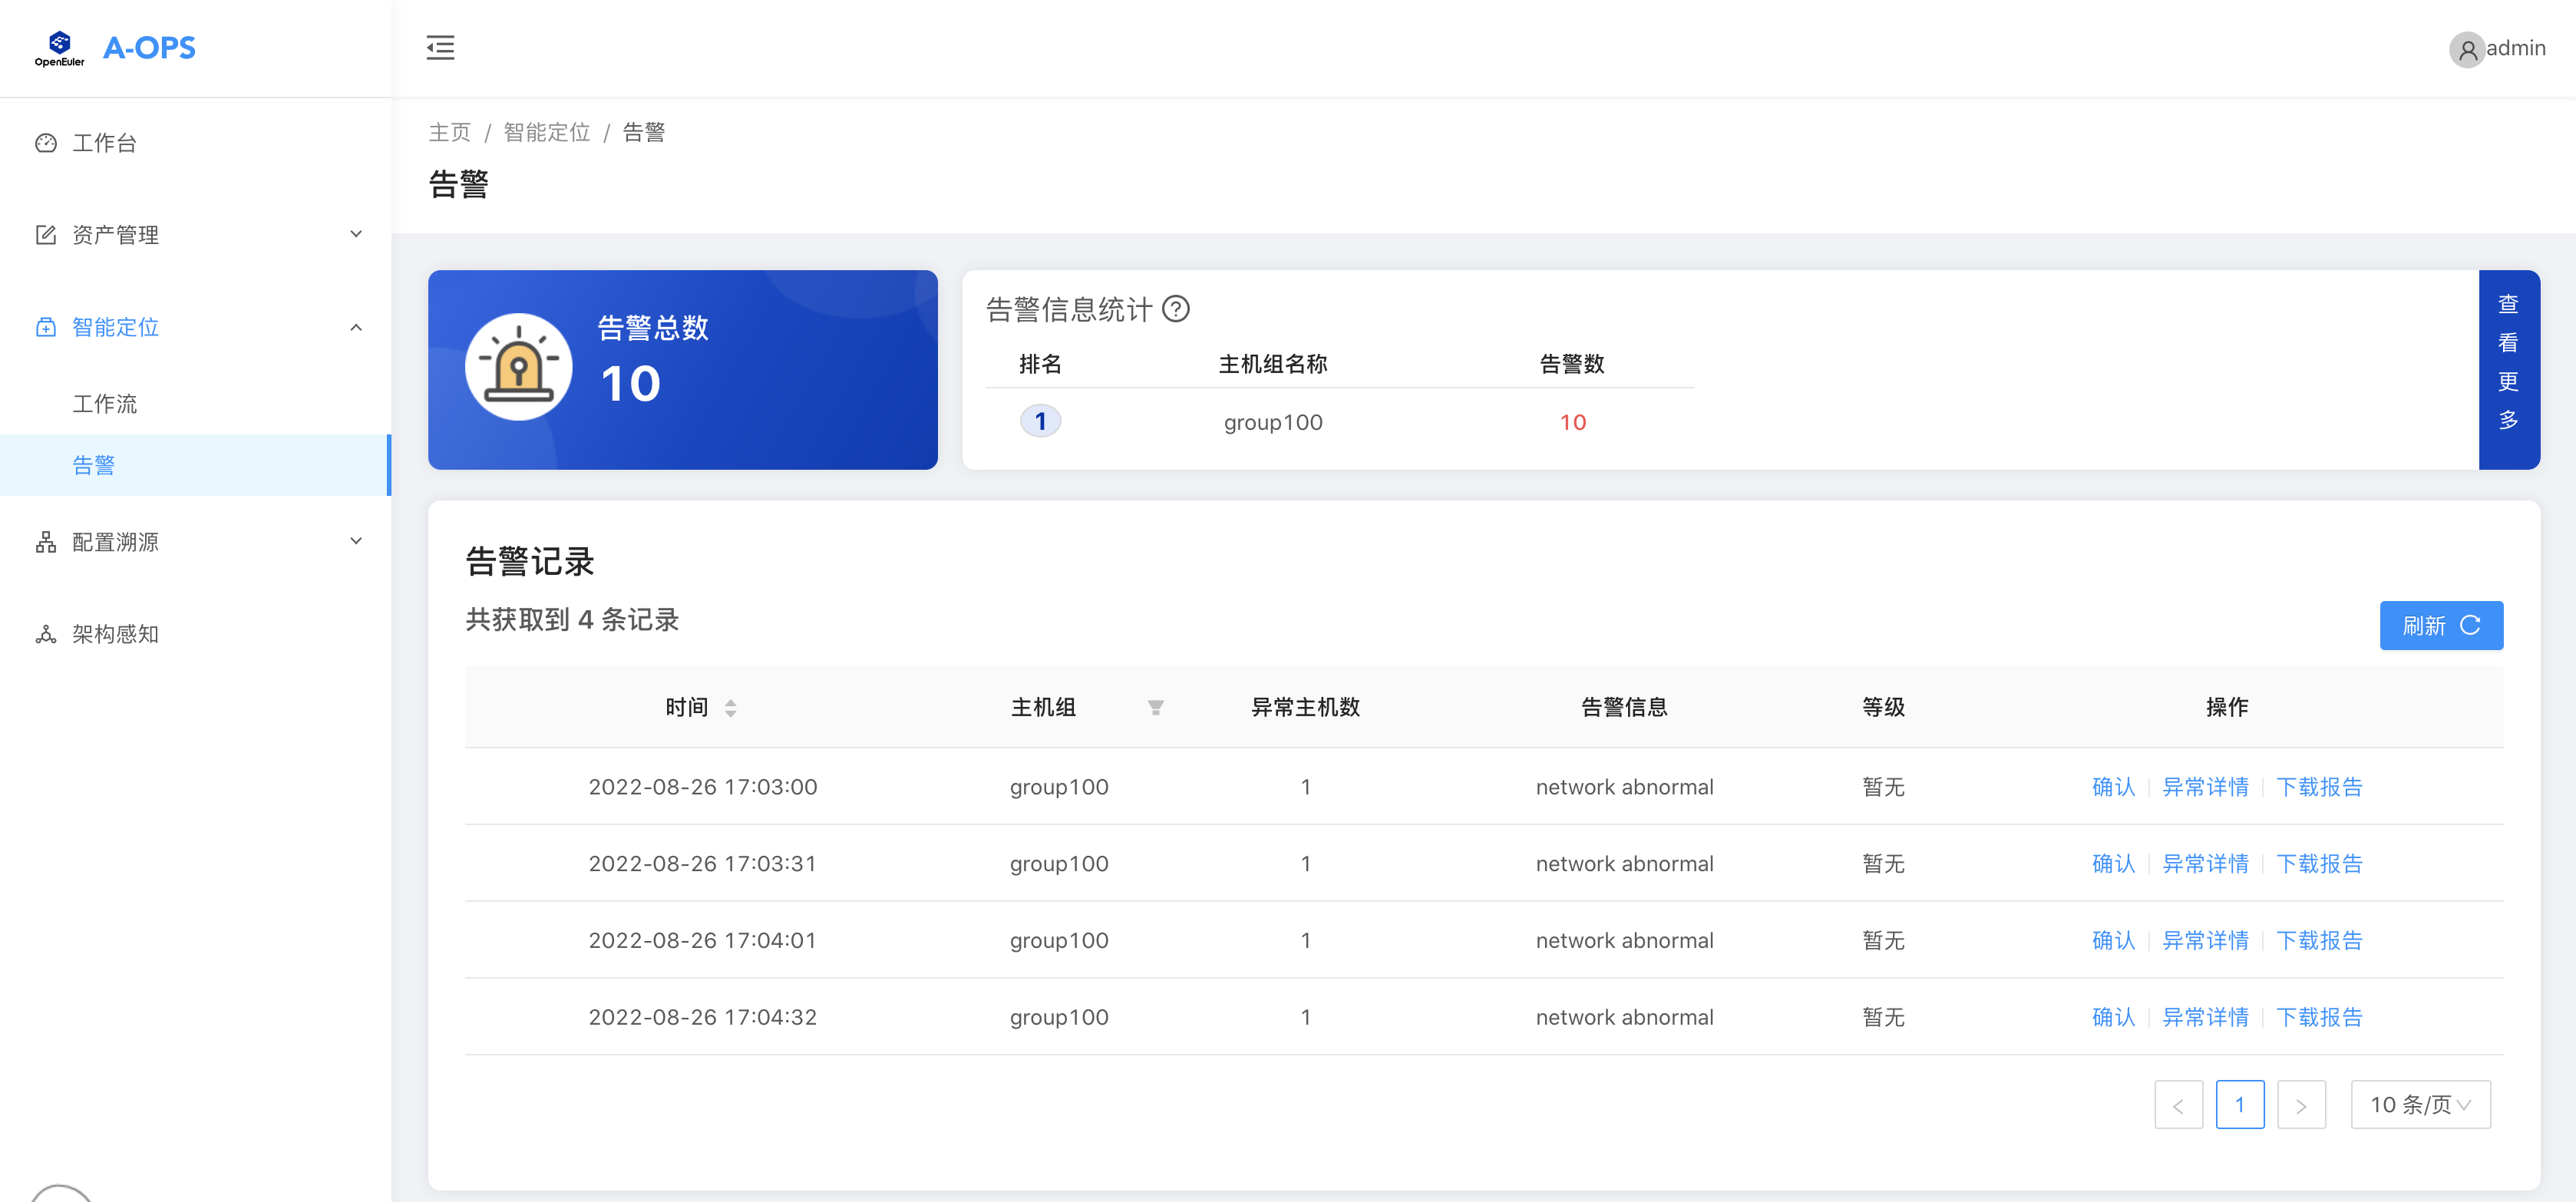
After a workflow is started, diagnosis is triggered periodically based on the execution period of the workflow. If the diagnosis result is abnormal, an alarm is stored in the database and displayed on the frontend alarm page.
Supported operations:
- Viewing the total number of current alarms
- Viewing the number of alarms of each host group
- Viewing the alarm list
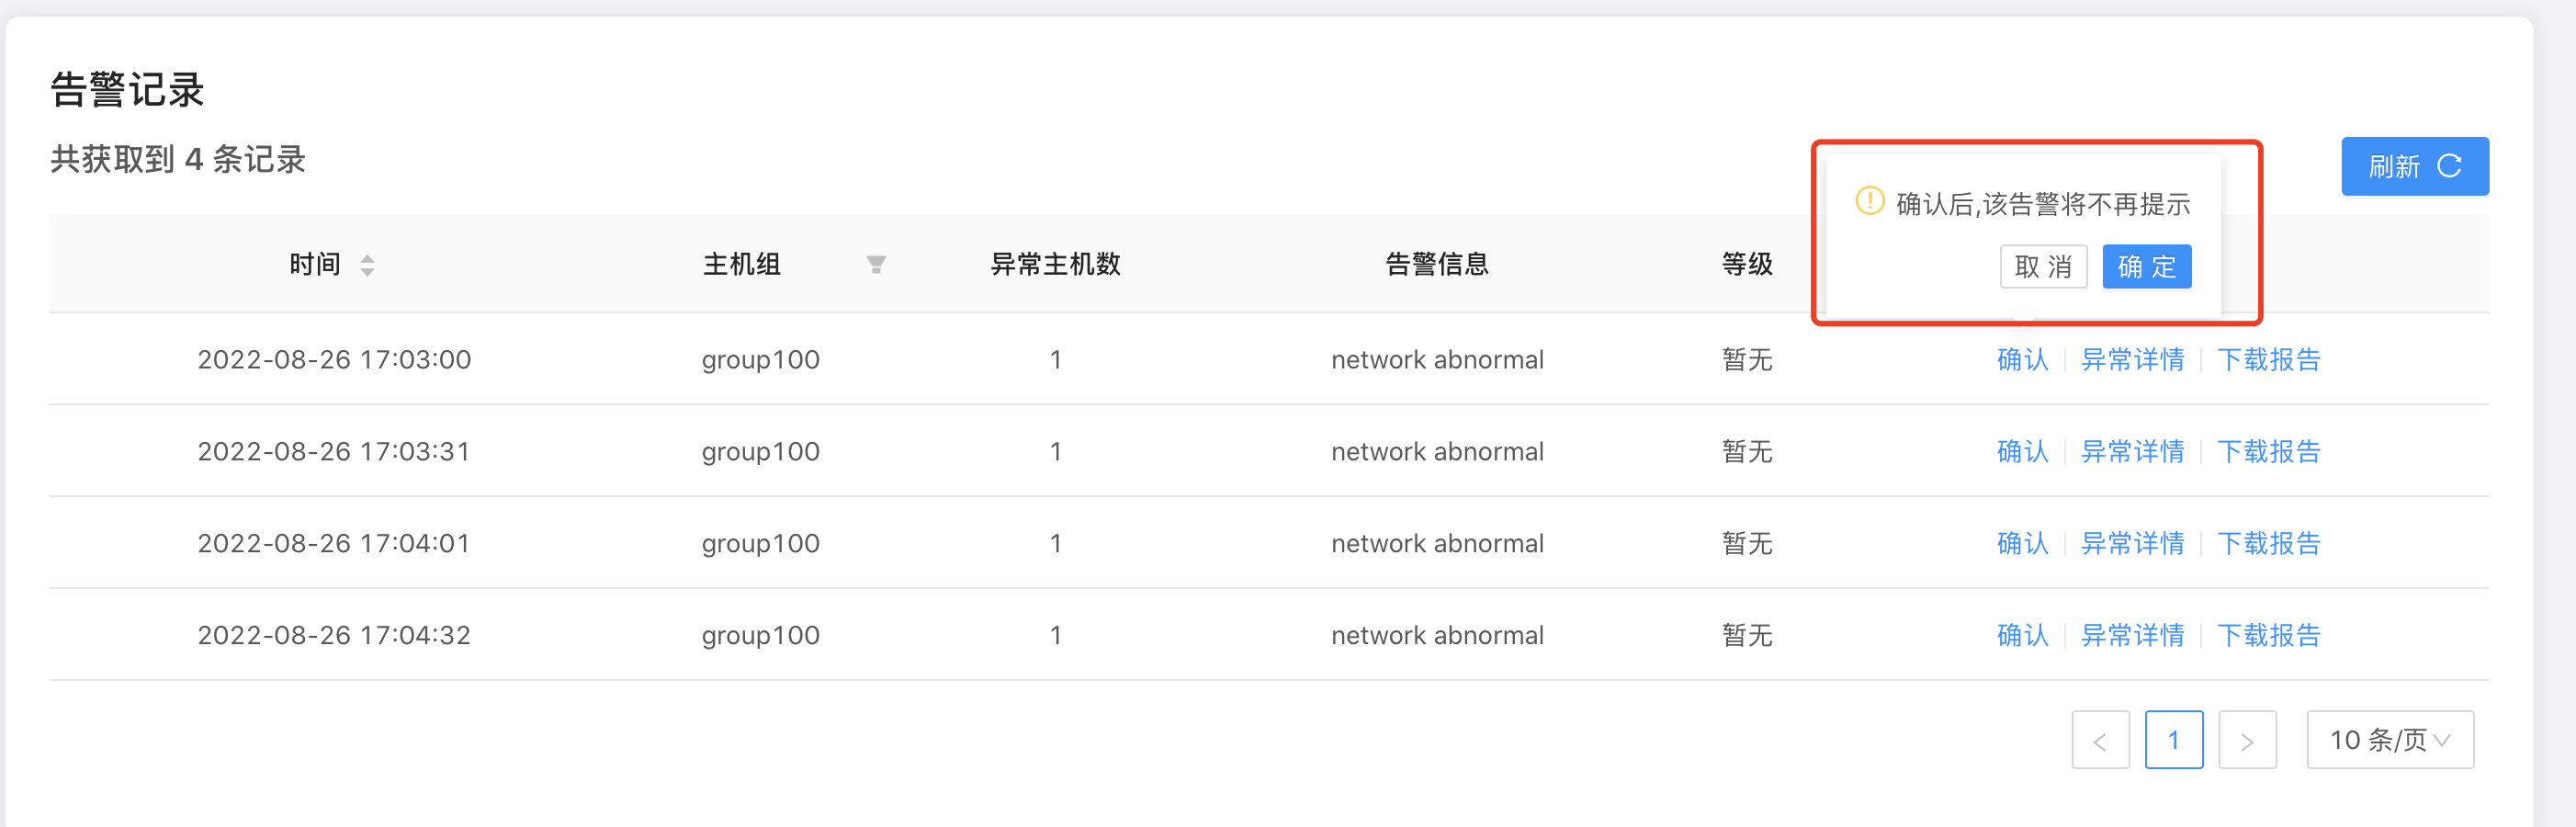
- Acknowledging an alarm
- Viewing alarm details
- Downloading a diagnosis report
After an alarm is acknowledged, it is no longer displayed in the list.
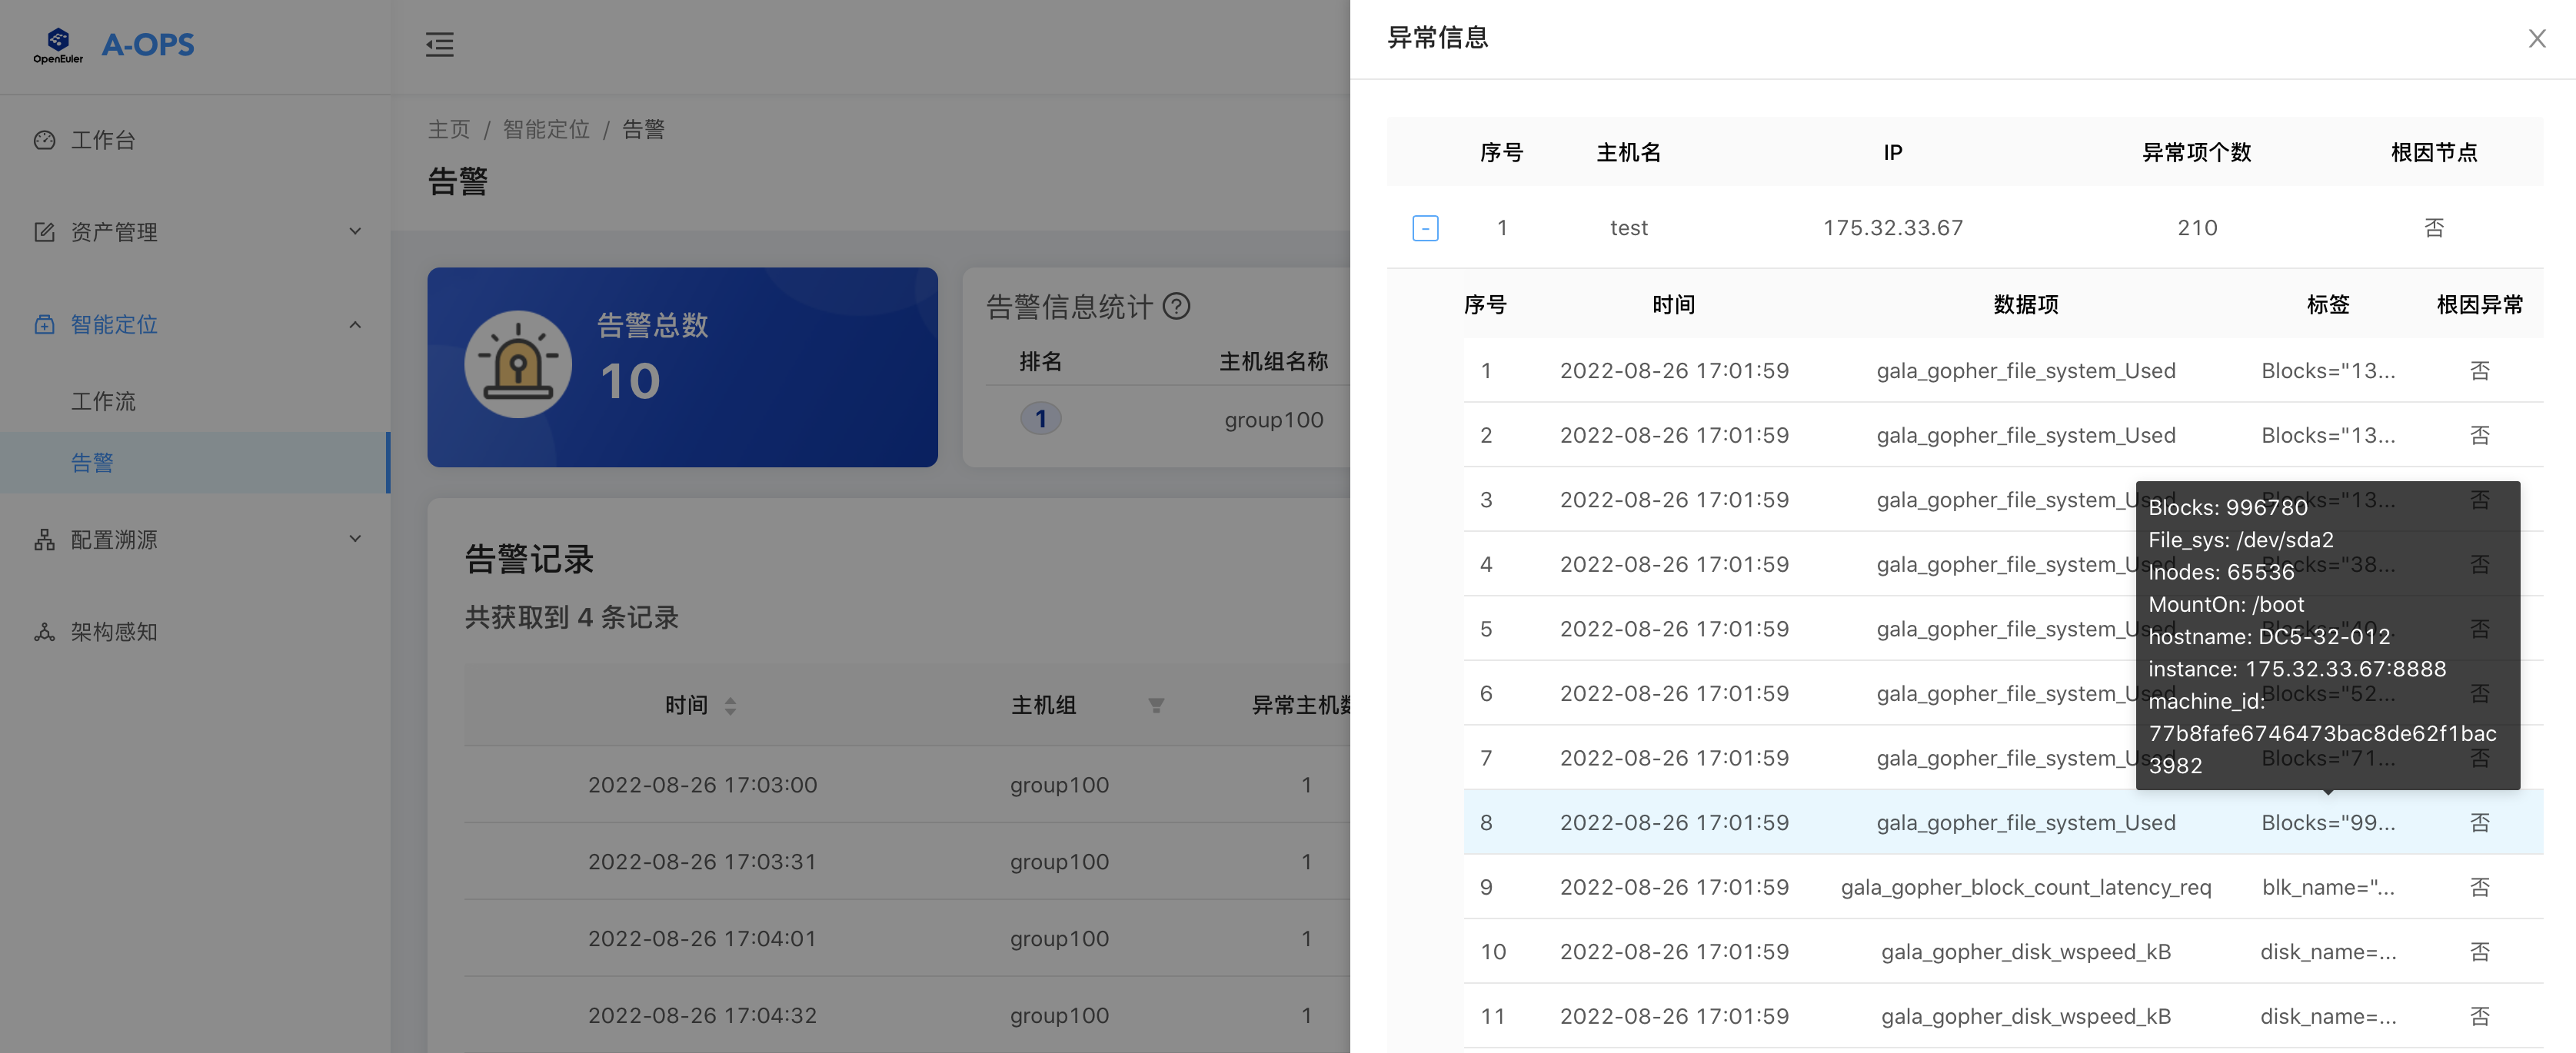
After you click the exception details, you can view alarm details by host, including the display of abnormal data items and the determination of root cause nodes and root cause exceptions.
Configuration Tracing
Configuration tracing of the AOps project is used to detect and record the changes of configuration file contents on target hosts, which provides good support for faults caused by incorrect file configurations.
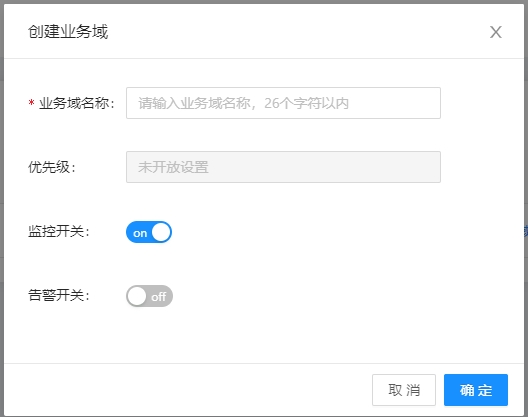
Creating a Configuration Domain
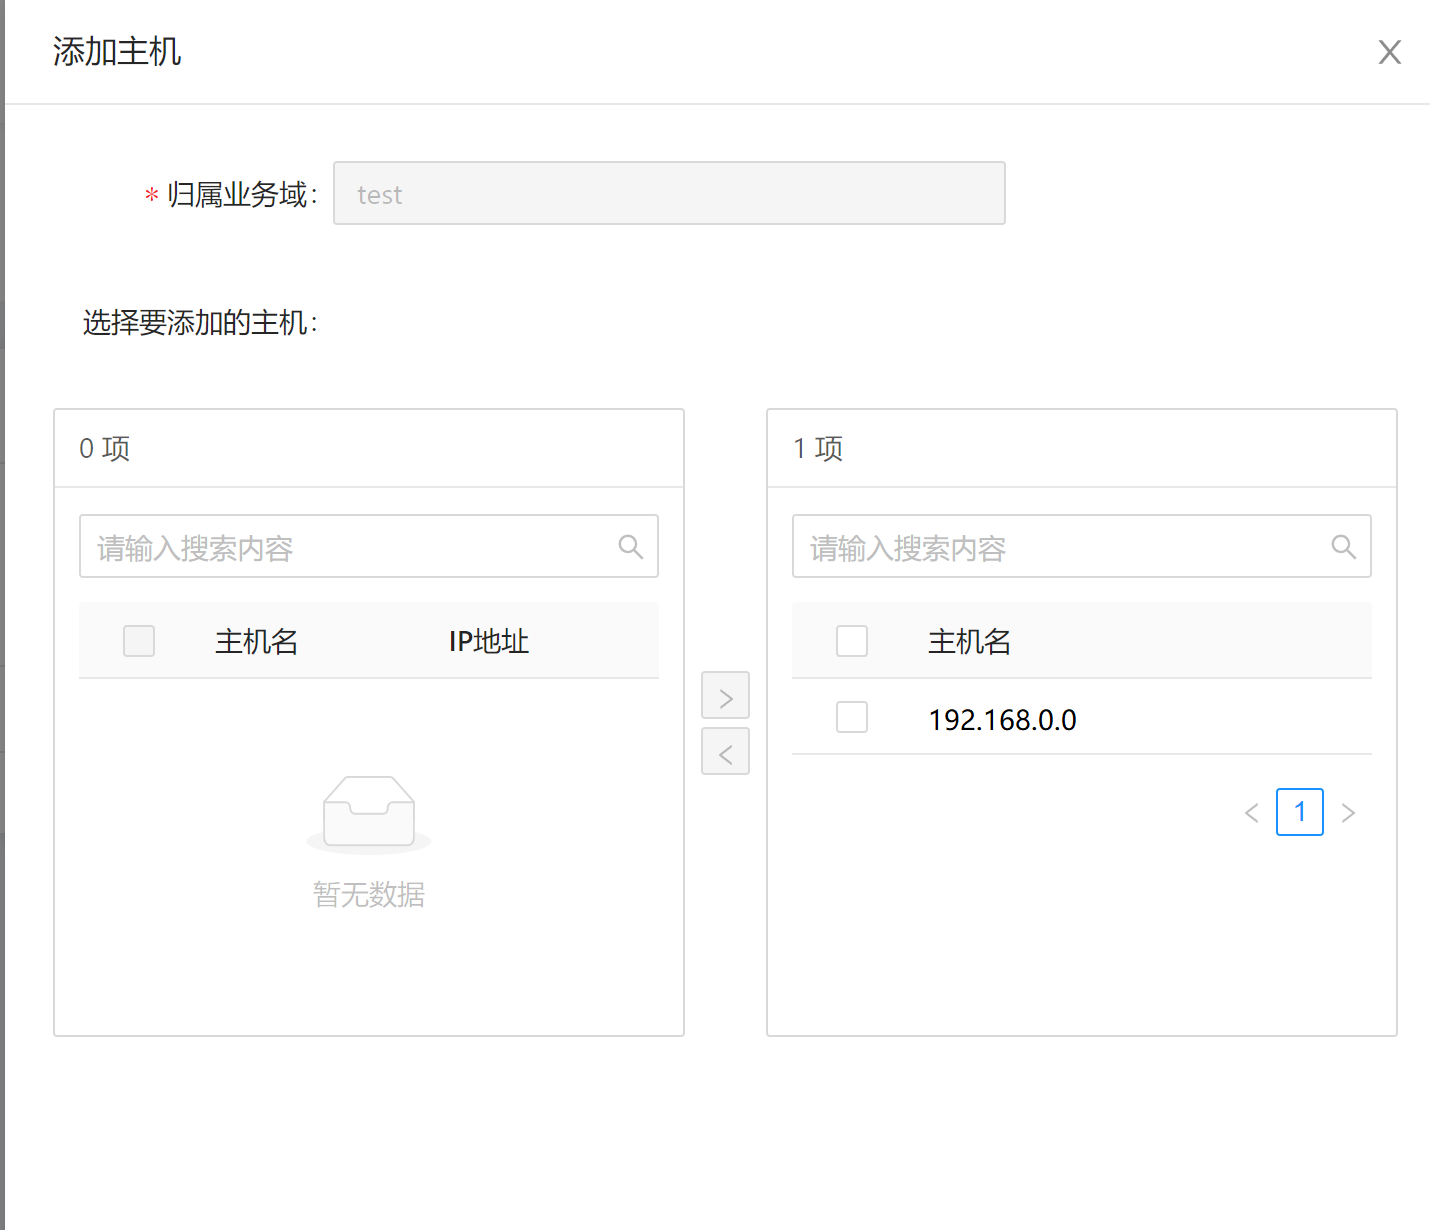
Adding a Managed Node to the Configuration Domain
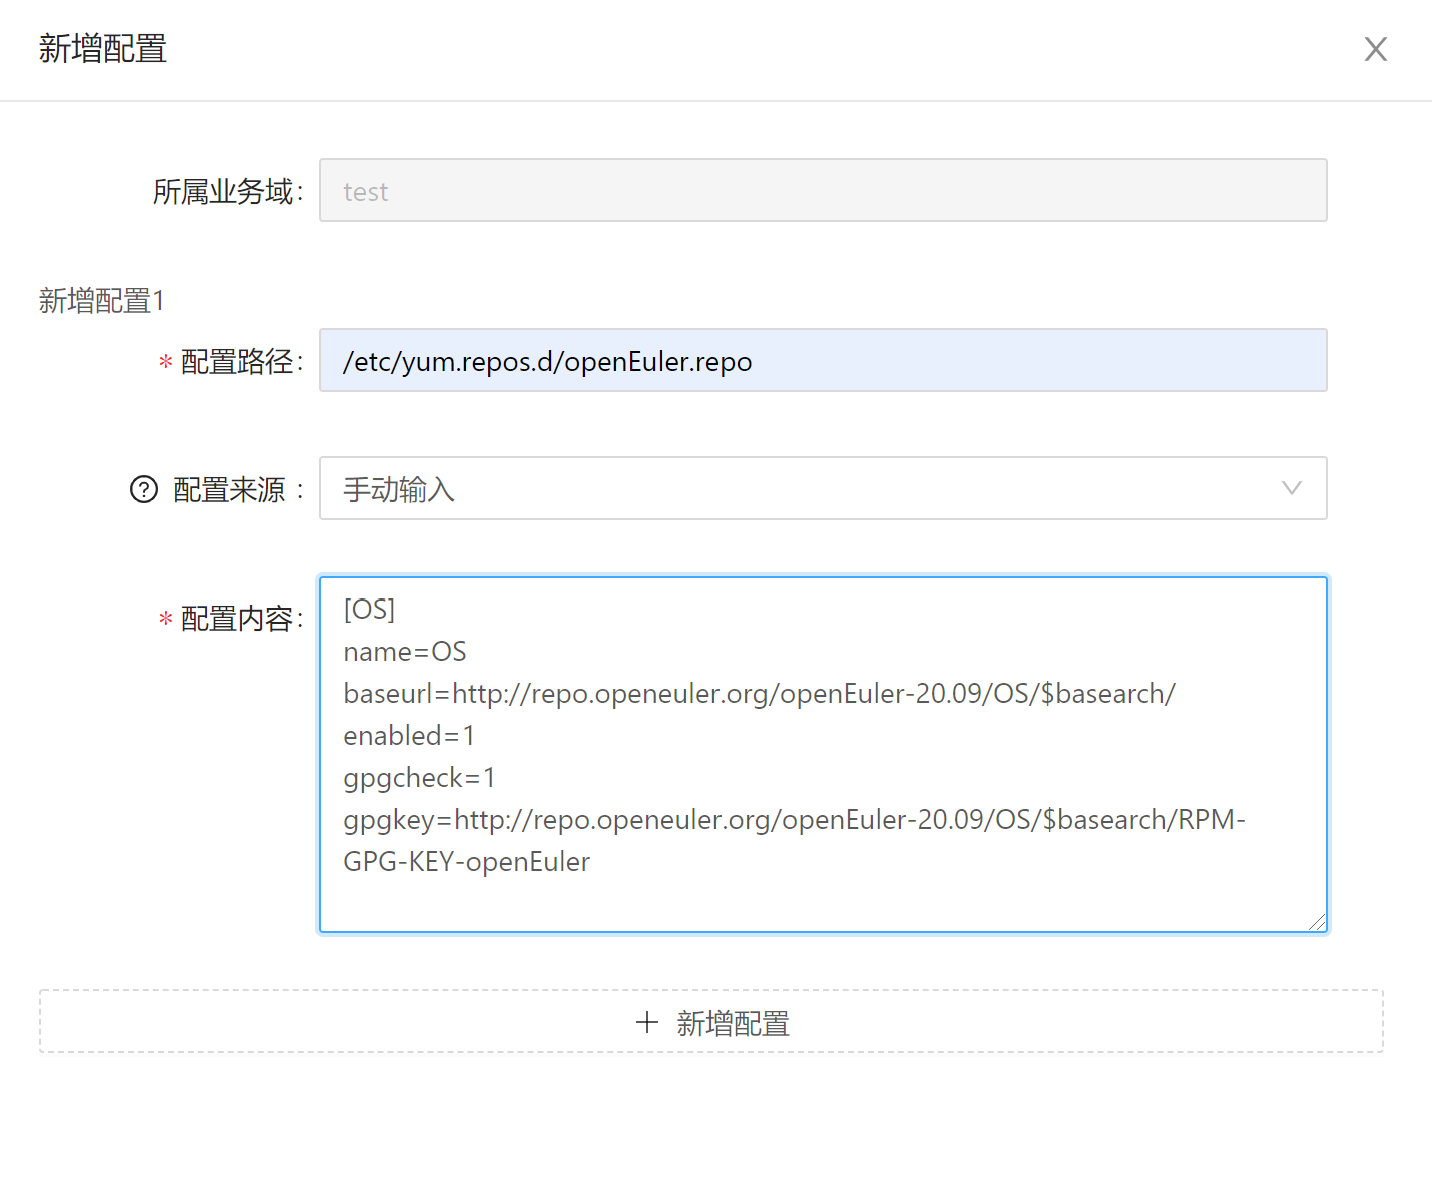
Adding a Configuration to the Configuration Domain
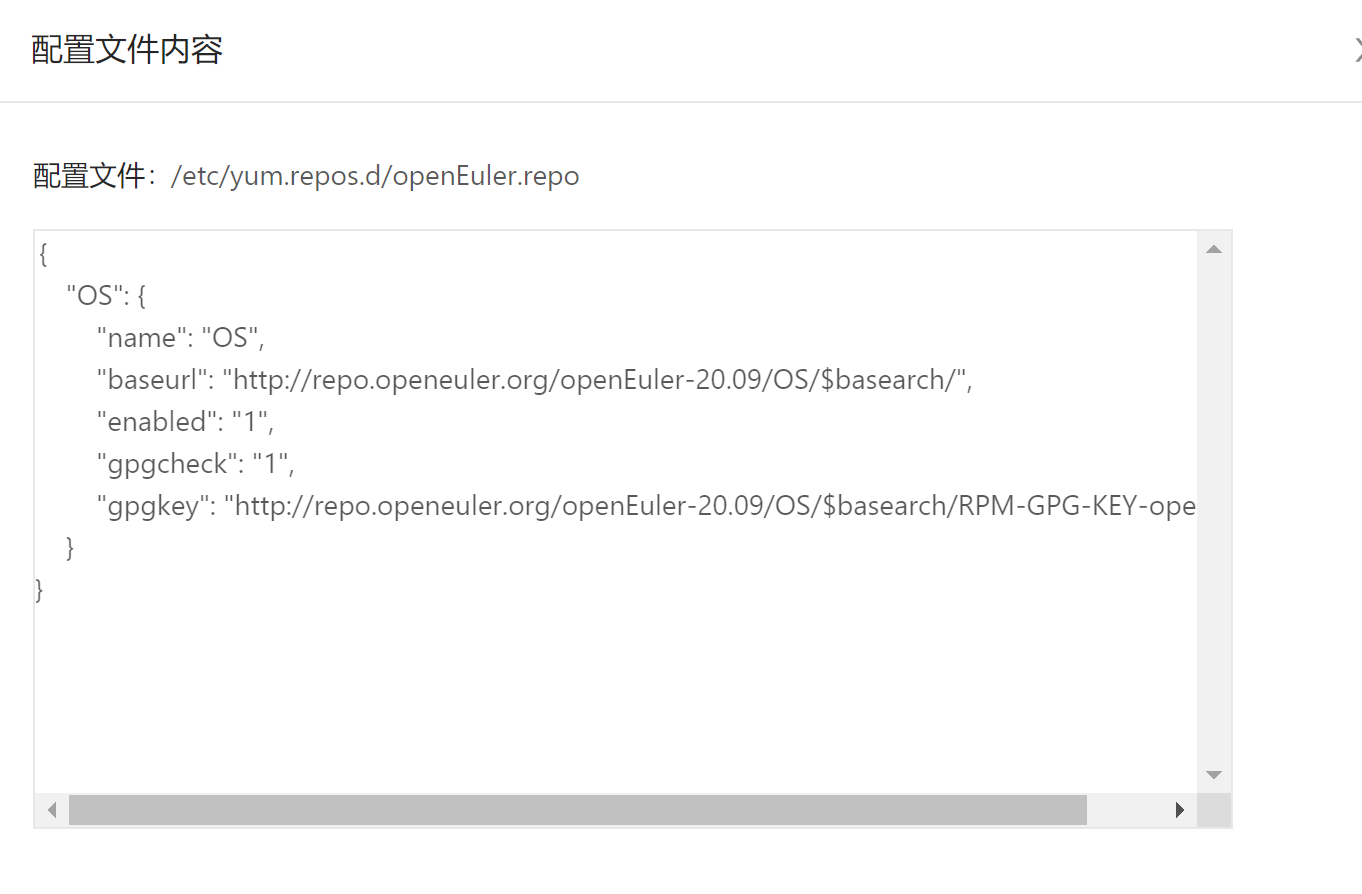
Querying the Expected Configuration
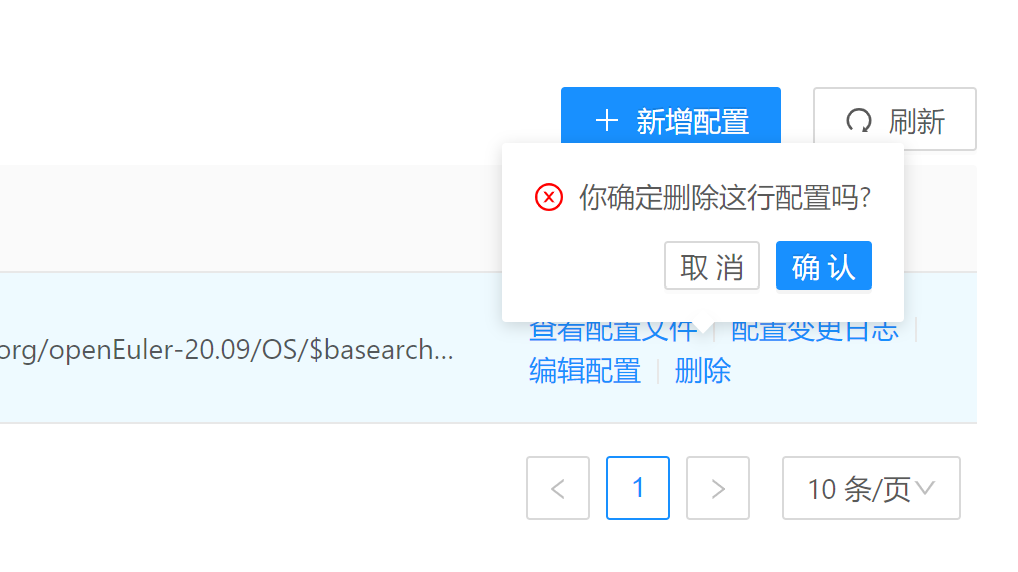
Deleting a Configuration
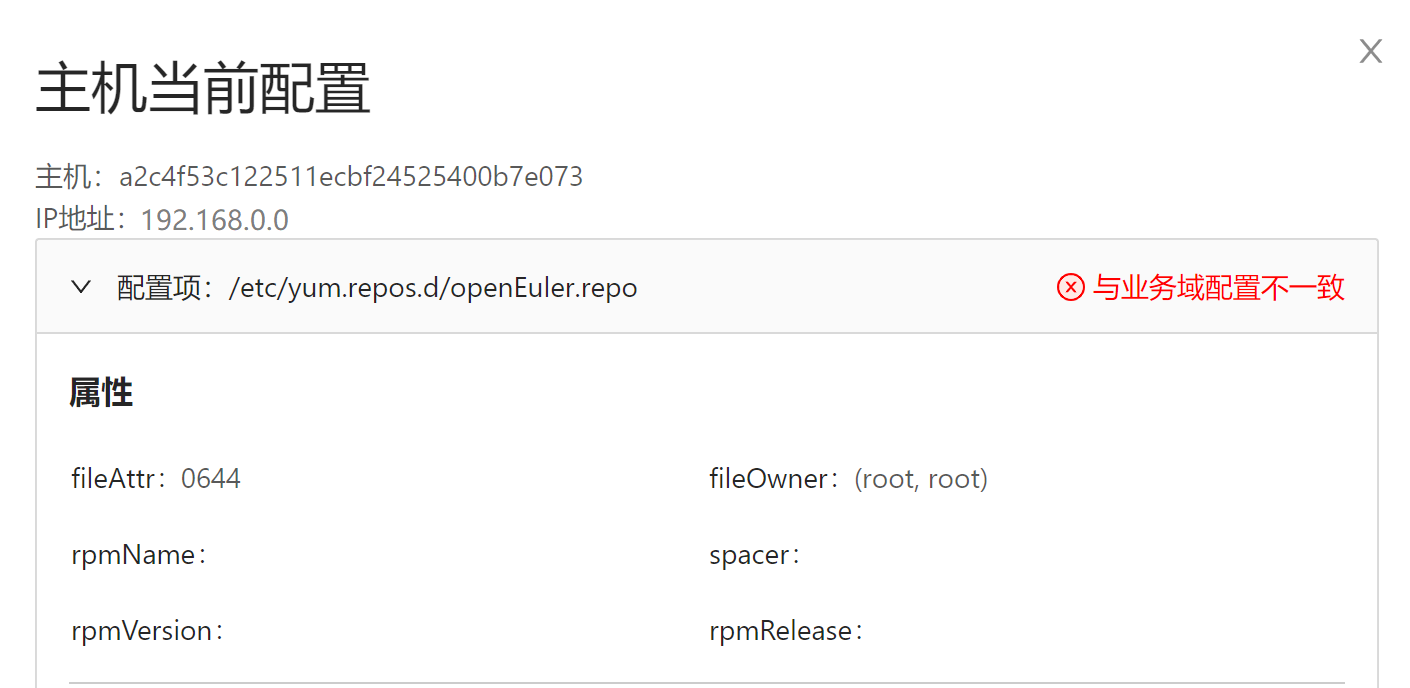
Querying the Actual Configuration
Checking the Configuration
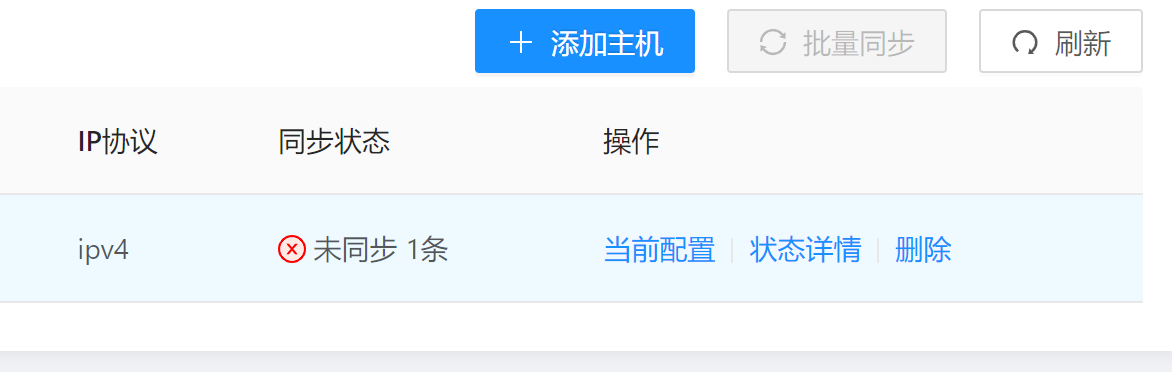
Synchronizing the Configuration
Not supported currently.
Licensed under the MulanPSL2
 J.G.W.A.B. No. 11030102011597